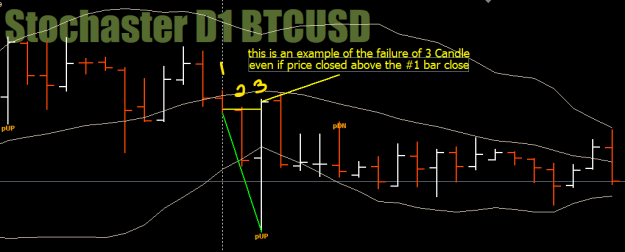
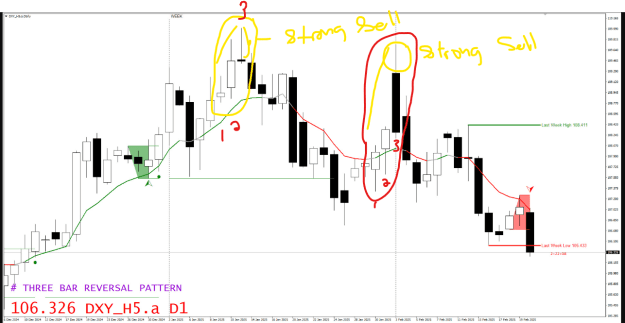
DislikedI found this thread as I was searching for 3-Bar Reversal Pattern with no success, not popular it seems. The charts on this thread seem subjective and hard to read. Anyway, here is what professional indicator shows. {image}Ignored
with bollinger bands price is/was at the bottom band already. if we look for buy opportunity we loss. and if we take a look and analyze the bar #3 price not close above previous high.
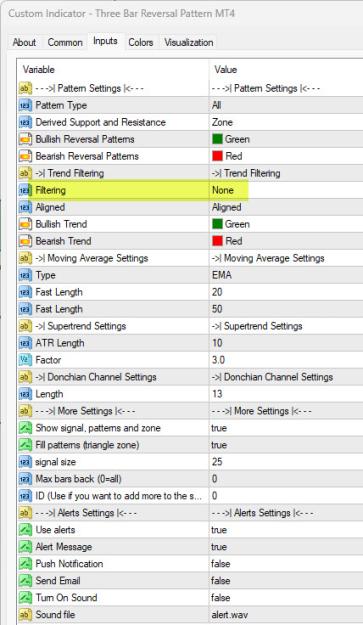
Attached Image (click to enlarge)
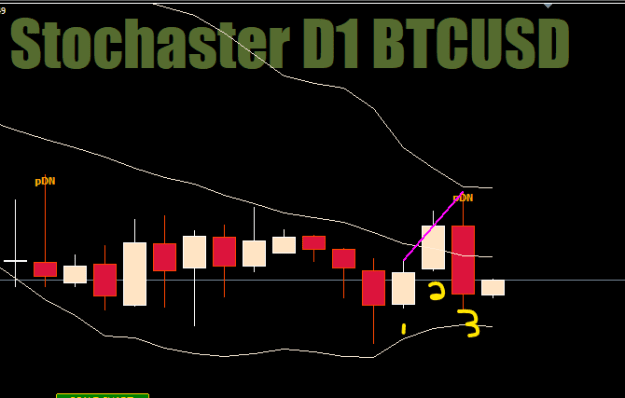
if we add bollinger band we can easily identify the direction with the 3 candle or 3 bar formation. heres the good and bad example of the 3 Candle as shown below image.
Attached Image (click to enlarge)
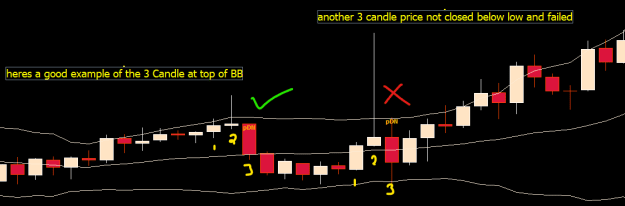
and another 3 bar formation that will give us the idea and we can easily read the chart and predict the movement of PA.
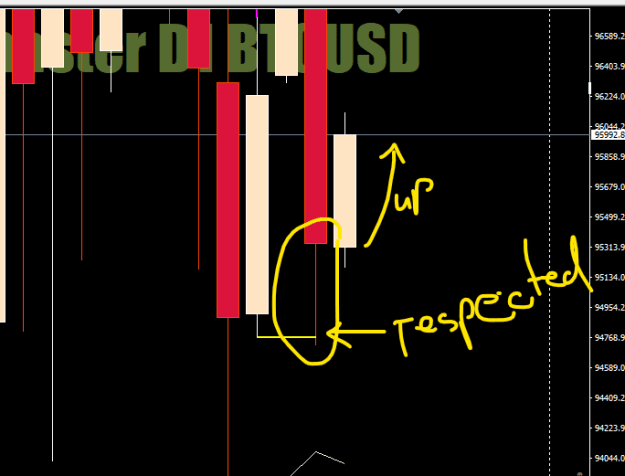
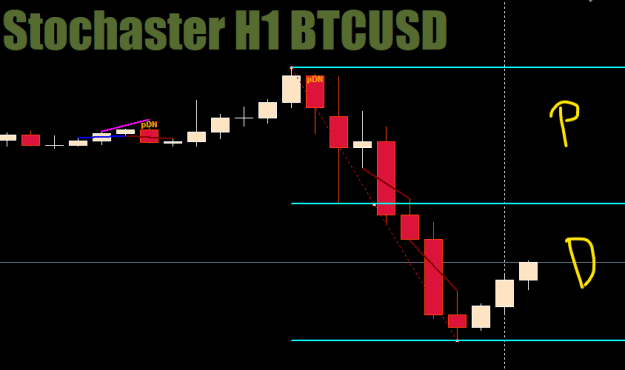
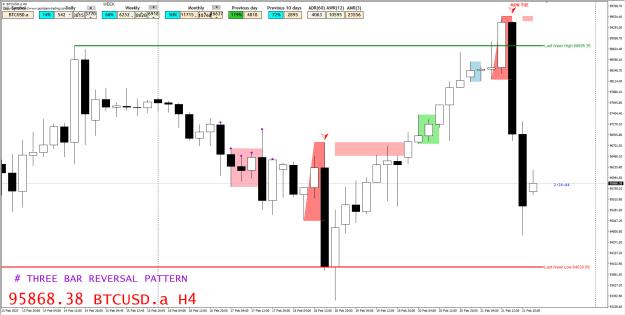
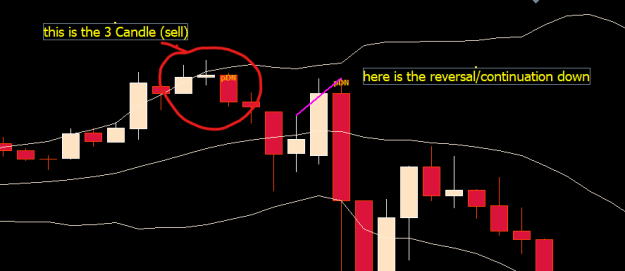
based on my research and a lot of testing, still we can find strong reversal by using the 3 bar formation (the Reverso Power Bars) as shown in image.
where price breaks the old highs and reverse to form the opposite bar against the two previous bars .
Attached Image (click to enlarge)
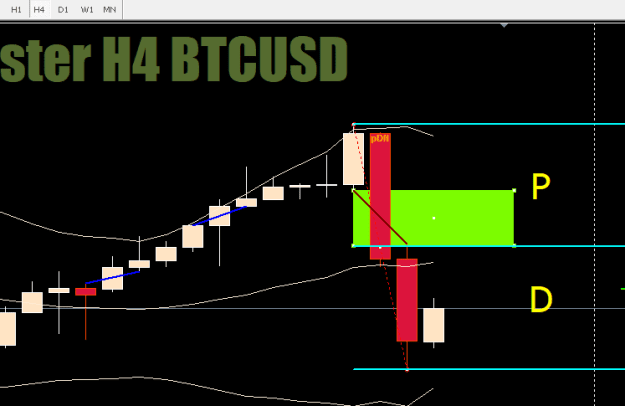
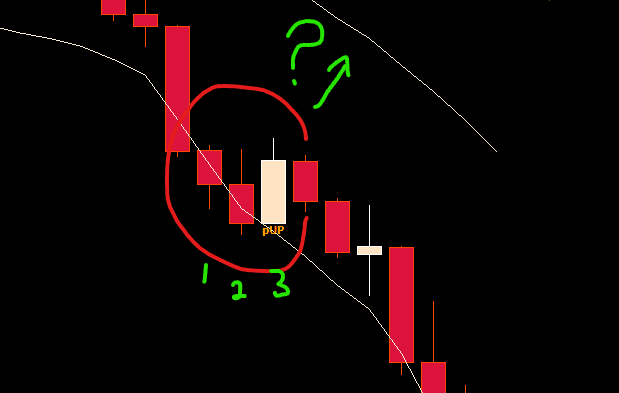
if we look for sell entries the two previous bars should be bullish and #2 bar should break the high of the previous bar, and in the same manner the #3 breaks the high of the #2 bar either we closed below low or not as long as it will form a bearish bar. but theres an addendum to this with a strong force for the sellers as shown in image. in the image for strong reversal we can use the wick for this instance (the upper wick).
and the opposite if we look for buy entries the two previous bars should be bearish and breaking previous lows and #3 bar should be bullish
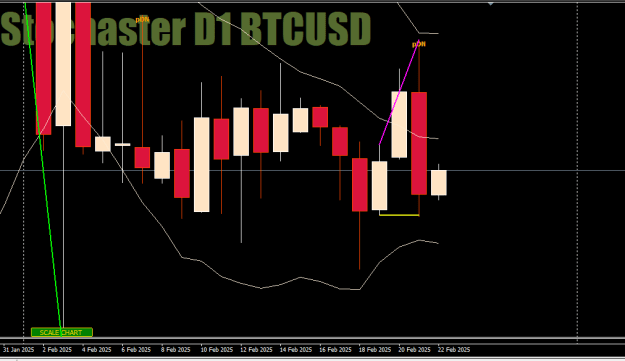
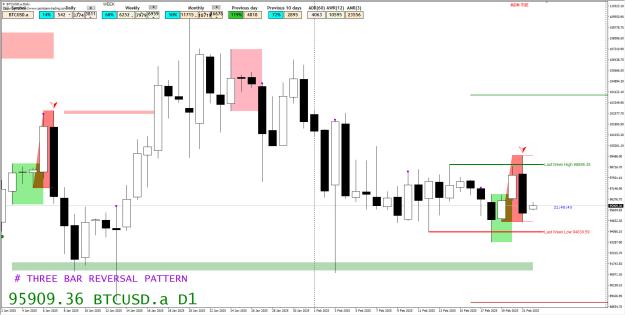
ill give you an example from my chart with the 3 candle and the pattern i used also for reversal and/or continuation. in the image below the (the Reverso Power Bars) is/was in the continuation mode. added on the chart is the bollinger bands.
Attached Image (click to enlarge)
1