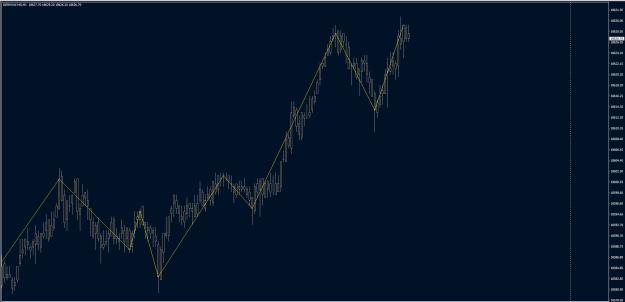
using candlestick what we have is this image
using linechart we have this image
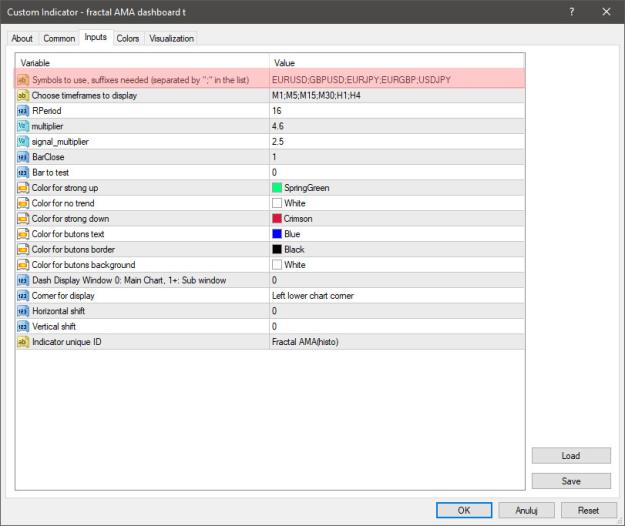
to our dear coders,
how to create a function by detecting those closed bars (for bear bars close - old and new) and (bull bar close - old and new) and plot a trend line starting of from the old close . the trend line will only stop if two bodies of candles crossed over and under the trend line. and if every add alert to every formation. thank you.
Attached Image (click to enlarge)
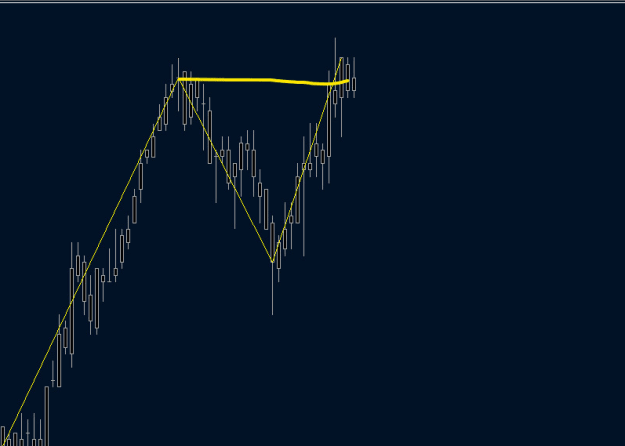
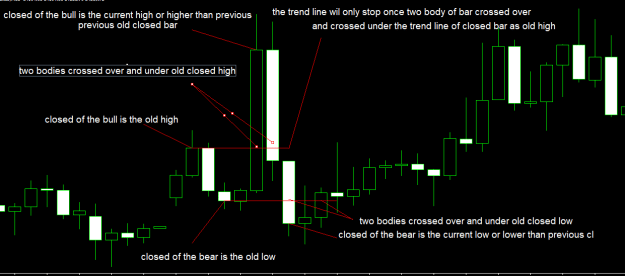
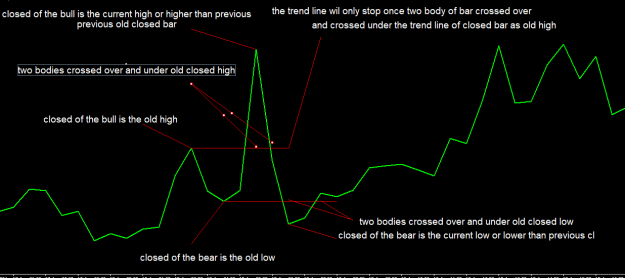
using linechart we have this image
Attached Image (click to enlarge)
to our dear coders,
how to create a function by detecting those closed bars (for bear bars close - old and new) and (bull bar close - old and new) and plot a trend line starting of from the old close . the trend line will only stop if two bodies of candles crossed over and under the trend line. and if every add alert to every formation. thank you.
1