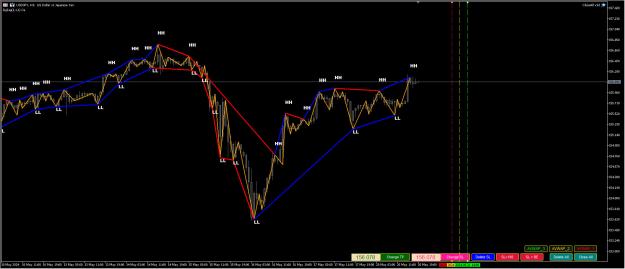
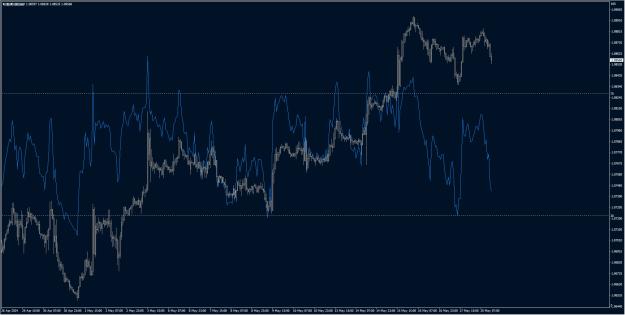
Dislikedhow to get a chart like this, which indicator to download {image}Ignored
And the subwindow is extended upwards.
So, most likely, the RSI is first, and then the chart overlay is dropped into th RSI subwindow.
Or, could be that the RSI is just plotted over the whole chart window.
Also, if you look closely, you will see MACD times 2:
Attached Image (click to enlarge)

I also remembered!
That's a compilation trick you could do.
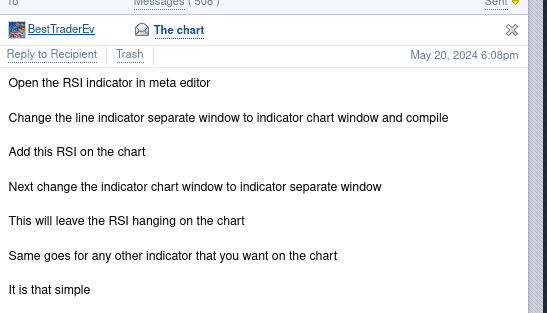
You must open RSI (for example) in Meta Editor,
change #property indicator_separate_window to #property indicator_chart_window,
compile it,
put the indicator on your chart,
change back to #property indicator_separate_window,
compile again.
This is the effect:
Attached Image (click to enlarge)
You will have to do this every time you start MT4 again.
.ex4/.ex5 files can't be fixed or modified / I'm not a coder!