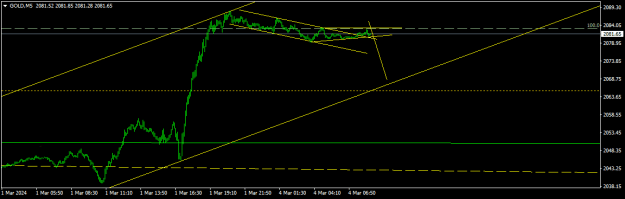
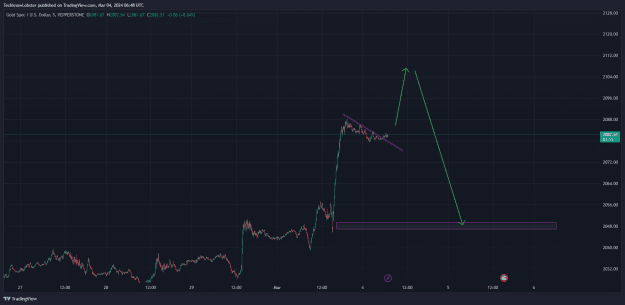
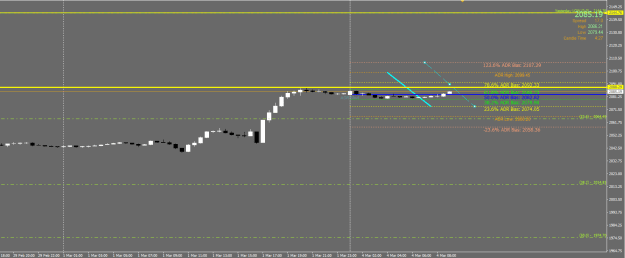
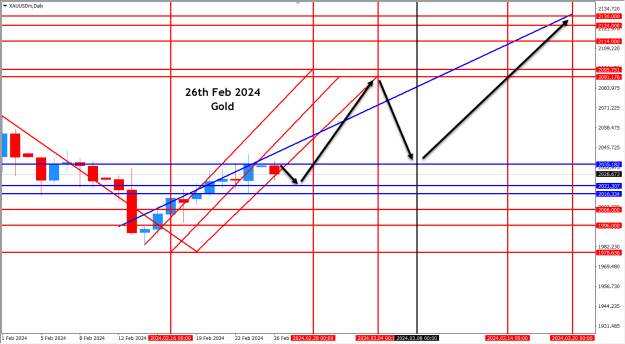
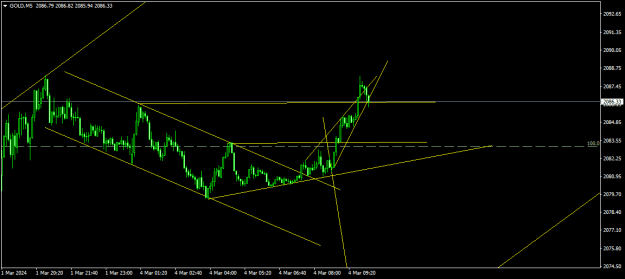
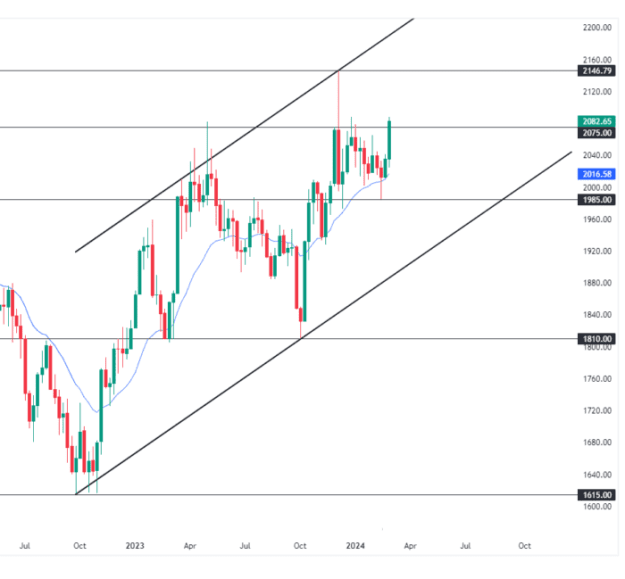
In the weekly gold chart, the market trend is bullish. Also, the price is in an upward channel, as the market recently jumped from the EMA 20 and crossed above the resistance of 2075. In this week's trading, if gold hits the support rate of 2075 and then crosses above the rate of 2082.65, we can expect the start of a new upward movement to the rate of 2146.79. But if the break of 2075 rate is fake, the recent upward movement of the gold will be limited and we can see the correction of the market towards the 20-day EMA.
Attached Image (click to enlarge)
2