Hello all respected coder
A dev is helping me build a scanner which scans for specific patterns and send alerts.
Within the scanner I have included various filters to work in different market conditions and change as per user preference. However, the Developer is struggling to code one of the specific modes.
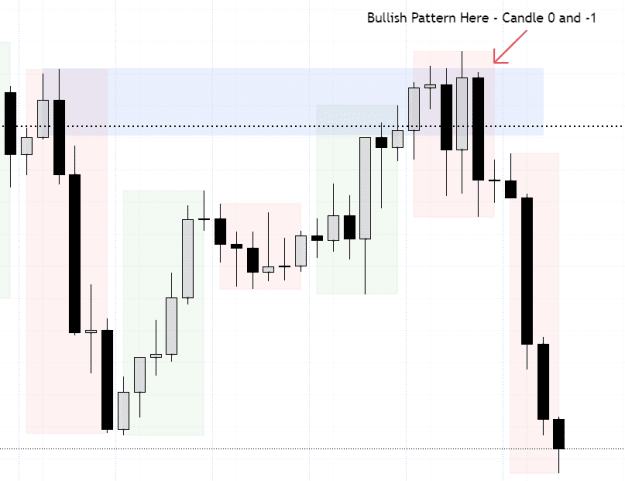
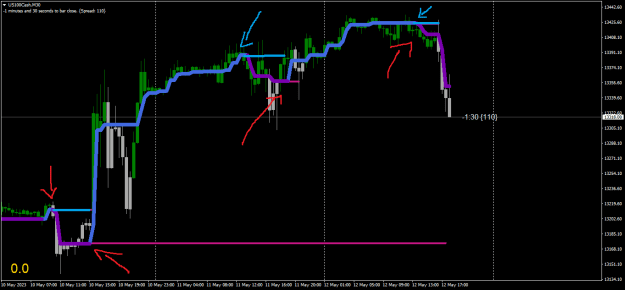
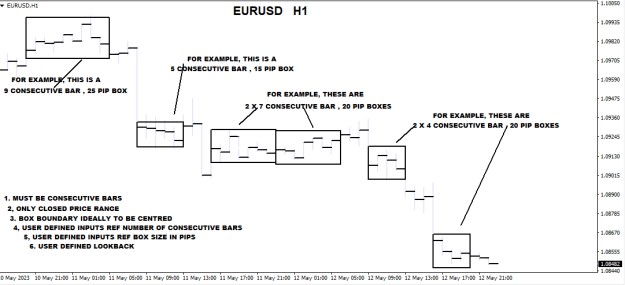
I simple terms, one of the modes is, I want the scanner to have the ability to draw higher timeframe zones and send alert ONLY if the pattern happens within that price range....OR similarly, to have the ability where I can draw a zone myself and get the alert ONLY if the pattern happens within that range.
The Issue we're facing here is its easy to do the pattern scanner using the formulas, which are of course limited to candle numbers eg. current candle being candle 0 and then 1 2 3 4 etc. However, we cannot work out how to code and integrate the zone drawing functions.
Can someone please help with some ideas in terms of what chart/coding functions to use to make this work. Picture is attached for reference in terms of how it would need to look/perform.
Of course the Higher timeframe zone will have set conditions like Bullish/bearish Engulfing zones. Or even if we can code to drawing the zones manually and then linking it to the pattern.
Thanks
A dev is helping me build a scanner which scans for specific patterns and send alerts.
Within the scanner I have included various filters to work in different market conditions and change as per user preference. However, the Developer is struggling to code one of the specific modes.
I simple terms, one of the modes is, I want the scanner to have the ability to draw higher timeframe zones and send alert ONLY if the pattern happens within that price range....OR similarly, to have the ability where I can draw a zone myself and get the alert ONLY if the pattern happens within that range.
The Issue we're facing here is its easy to do the pattern scanner using the formulas, which are of course limited to candle numbers eg. current candle being candle 0 and then 1 2 3 4 etc. However, we cannot work out how to code and integrate the zone drawing functions.
Can someone please help with some ideas in terms of what chart/coding functions to use to make this work. Picture is attached for reference in terms of how it would need to look/perform.
Of course the Higher timeframe zone will have set conditions like Bullish/bearish Engulfing zones. Or even if we can code to drawing the zones manually and then linking it to the pattern.
Thanks
Attached Image (click to enlarge)