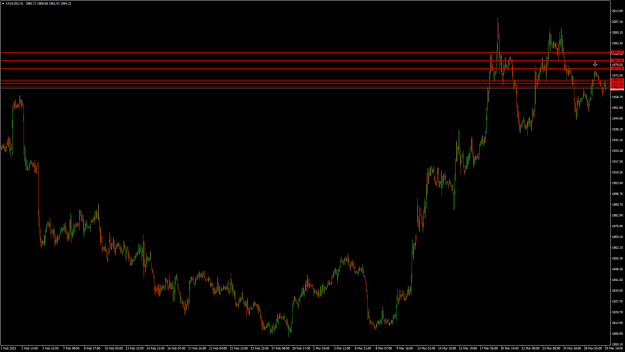
here's a 6 month chart ....i think price will range within those 2 lines for the nest 10 years {image}
Ignored
Maybe you're right, but I don't think it's wise to predict future ups and downs in advance.
What we need to do is to spot the trend and then follow it.
If 1956-58 holds,price will break 1973...next target 1982,1992...
If breaks next level of support at 1946-40......
Today price will swing around 1965...
{quote}For me .....Market will be stuck in the high range as mentioned in my previous post for at least next 4-5 day so 1933 seems not possible. So I expect Bullish move possibly today till 1981 and if it will be broken then 1992.Maximum bears move can become 1952 area today.I may be wrong.Trade safe Break of 1962 has not been confirmed yet for bear move so more confirmation needs for bearish entry.I may be wrong.Trade safe
Ignored
1958-1948 is the obvious support level below. My view is that the uptrend continues mainly if the price does not fall below 1948.
If 1956-58 holds,price will break 1973...next target 1982,1992... If breaks next level of support at 1946-40...... Today price will swing around 1965... Trade safe
I'm not sure gold will make it to 1915.
As it stands now, for gold to continue to fall, it has to fall below 1933 and then 1915.
I don't try to tell where it will go in advance, what I do is follow the trend.
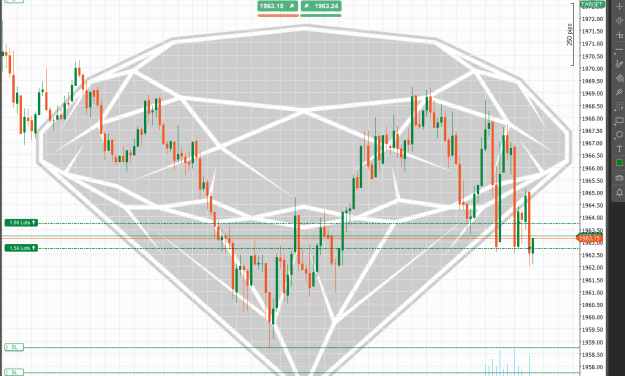
{quote} It getting acceleration from the mentioned point 1958.64...
Ignored
Yes. 1958 is a support level and is supported. How long it will last, no one knows this.
Just be patient and wait for time to develop. I still have the same opinion, as long as it does not fall below 1933, I remain long.
{quote} bad sign for gold, btcusd, btceur and good news for usdjpy .
Ignored
hi guys. Just personal view. Time to downswing gold. Gold just hint us about bearish after rejected main point 1977 (consolidation h4 zone). Bad sign for gold to 1800-+. Im looking for sell stop below 1965. trade safe
if up.., to be precise could be 1982.84 & 1985.47 (Monday missing PP, DeMark's & Classic, accordingly)
...if down I am looking for1850th & 1842th
P.S. still 1967th to watch
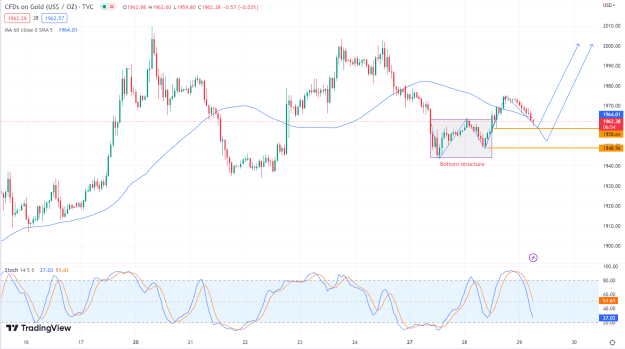
{quote} hi guys. Just personal view. Time to downswing gold. Gold just hint us about bearish after rejected main point 1977 (consolidation h4 zone). Bad sign for gold to 1800-+. Im looking for sell stop below 1965. trade safe {image}
Ignored
It seems only retracement of M30 & 1H from golden ratio 61.8% to 50%. It will be better to wait for 4H close because 50% is also holding well. I may be wrong.Trade safe
{quote} hi guys. Just personal view. Time to downswing gold. Gold just hint us about bearish after rejected main point 1977 (consolidation h4 zone). Bad sign for gold to 1800-+. Im looking for sell stop below 1965. trade safe {image}
Ignored
As per my analysis Retracement of correction wave C will be 1870-1860,there i a gap in my system at 1870 to be filled...
1935 will be the key for next direction....
Scalping only till that!
{quote} It seems only retracement of M30 & 1H from golden ratio 61.8% to 50%. It will be better to wait for 4H close because 50% is also holding well. I may be wrong.Trade safe