Dear Coders,
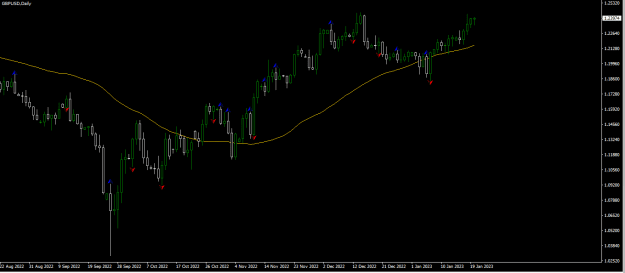
I would like to have a more organised look at the PA on every third Fri of the month, in a sequence and colour differential described below.
I am looking for a coder to create an indicator for MT4 showing the following:
Spring Triple witching Friday, Third Fri in March, Colour Green, continuous vertical line line
Third Fri in April, Colour Green, vertical line dotted
Third Fri in May, Colour Green, vertical line interspaced
Summer Triple witching Friday, Third Fri in June, Colour Red, continuous vertical line line
Third Fri in July, Colour Red, vertical line dotted
Third Fri in August, Colour Red, vertical line interspaced
Autumn Triple witching Friday, Third Fri in September, Colour Yellow, continuous vertical line line
Third Fri in October, Colour Yellow, vertical line dotted
Third Fri in November, Colour Yellow, vertical line interspaced
Winter Triple witching Friday, Third Fri in December, Colour Blue, continuous vertical line line
Third Fri in January, Colour Blue, vertical line dotted
Third Fri in February, Colour Blue, vertical line interspaced
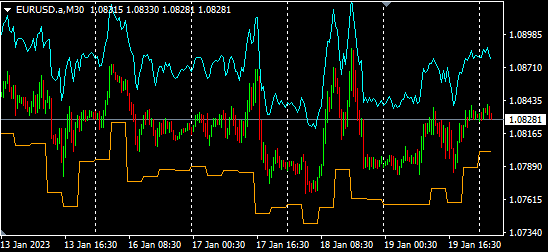
If possible I would like to have a possibility to use historical data, and also be able to have these vertical lines appearing as the time progresses.
The reason for this indicator is to observe PA days before these Fridays and days immediately following these Fridays.
I have observed that PA before these 3rd Fridays is very volatile, and have posted that observations many times, however I would like some more statistical observation, allowing an approach based on these stats.
With the colour variation the four Quarters are easily recognised and the different styles of the vertical lines will make it easy which particular third Friday of the month is displayed.
It is likely that the coding might be very demanding, as the dates have to be included, and if is at all possible to code it,I would be very grateful for coding this indicator.
Many thanks,
2be
I would like to have a more organised look at the PA on every third Fri of the month, in a sequence and colour differential described below.
I am looking for a coder to create an indicator for MT4 showing the following:
Spring Triple witching Friday, Third Fri in March, Colour Green, continuous vertical line line
Third Fri in April, Colour Green, vertical line dotted
Third Fri in May, Colour Green, vertical line interspaced
Summer Triple witching Friday, Third Fri in June, Colour Red, continuous vertical line line
Third Fri in July, Colour Red, vertical line dotted
Third Fri in August, Colour Red, vertical line interspaced
Autumn Triple witching Friday, Third Fri in September, Colour Yellow, continuous vertical line line
Third Fri in October, Colour Yellow, vertical line dotted
Third Fri in November, Colour Yellow, vertical line interspaced
Winter Triple witching Friday, Third Fri in December, Colour Blue, continuous vertical line line
Third Fri in January, Colour Blue, vertical line dotted
Third Fri in February, Colour Blue, vertical line interspaced
If possible I would like to have a possibility to use historical data, and also be able to have these vertical lines appearing as the time progresses.
The reason for this indicator is to observe PA days before these Fridays and days immediately following these Fridays.
I have observed that PA before these 3rd Fridays is very volatile, and have posted that observations many times, however I would like some more statistical observation, allowing an approach based on these stats.
With the colour variation the four Quarters are easily recognised and the different styles of the vertical lines will make it easy which particular third Friday of the month is displayed.
It is likely that the coding might be very demanding, as the dates have to be included, and if is at all possible to code it,I would be very grateful for coding this indicator.
Many thanks,
2be
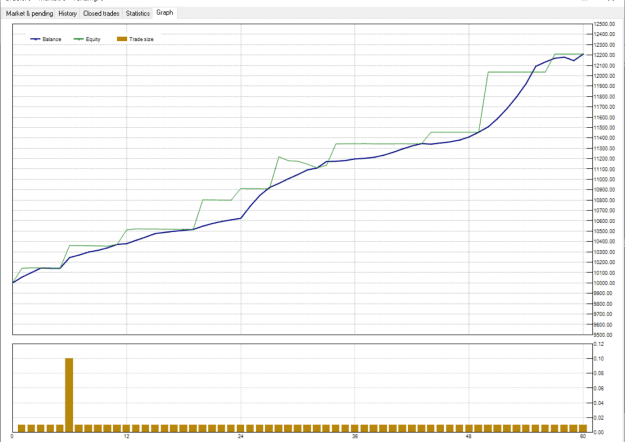
Make sure losses are small and profits are bigger!