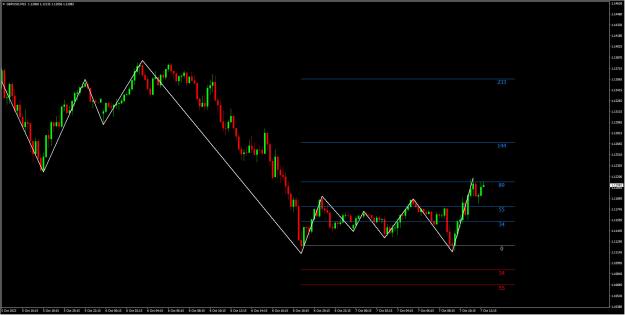
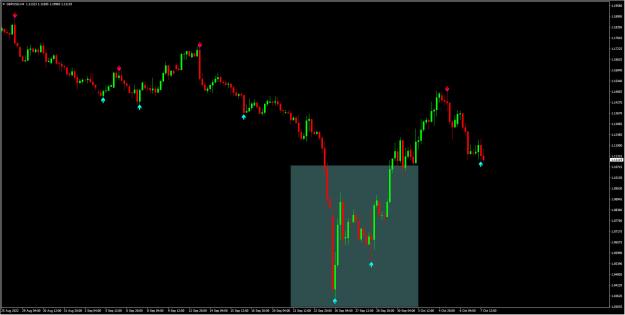
Disliked{quote} Well, I have played with it a bit: 1. Option to plot it by Tf Open price; 2. Option to plot it by specific date and time; 3. Option to plot it by OnClick on candle; This way you get a multi tool, which can be used in different contexts. {file} So, in the OnClick mode you can use it with ZigZag, or anything else. Here is one example how this can be used: {image} Of course, this is after the fact, but with such a tool you can look back in history, check out all the different situations, and build a strategy around this tool. It is so simple...Ignored
Inserted Code
      int i=0;
      while(found<5){
         if(iCustom(Symbol(),period,"ZigZag",ZL,5,3,0,i)!=0){
            swing_value[found]=iCustom(Symbol(),period,"ZigZag",ZL,5,3,0,i);
            swing_date[found]=iTime(Symbol(),period,i);
            found++;
         }
         i++;
      }
for finding zigzag levels