Just a question BW. Are you using Market Profile in your charts? Your strategy is a lot similar to market profile using the Auction Market Theory where the POC is the fair value (in your case the DOL, WOL, and MOL). Further, in Auction Market Theory overvaluation/undervaluation is observed through the value areas (in your case thru ADR exhaustion?)
Ignored
Hi FMA, no I don't use MP. Besides the open lines and adr for expansion projection and calibration, this buy and sell hemisphere is important in my strategy. Market flip from buy to sell hemisphere that's time based in clear demarcation. Just that traders don't see them even though they experience it everyday. Look back at the charts I posted earlier, you see my trades are at or close to this change of hemisphere.
The problem with identifying this hemispheres is 3 fold. Such hemispheres are mostly long and protracted, however they lose proper identification with volatility, that's why its harder to identify hemispheres with volatile markets.
Hemispheres are likely to flip at intended value target. This means the trader has to know what the target in each hemisphere. Market does not just move value up or down inside a hemisphere, it has a value target.
To add to the confusion, there's recalibration mostly due to change in fundamentals. To the untrained eye, traders can't tell the difference between an ongoing recalibration from a volatile market.
Adr give metrics to the intended target in their respective hemispheres. And open lines give orientation of value intent.
{quote} Hi FMA, no I don't use MP. Besides the open lines and adr for expansion projection, this buy and sell hemisphere is important in my strategy. Market flip from buy to sell hemisphere that's time based in clear demarcation. Just that traders don't see them. Look back at the charts I posted earlier, you see my trades are at or close to this change of hemisphere.
Ignored
I see.
Above DOL, WOL, and MOL is buy hemisphere.
Below DOL, WOL, and MOL is sell hemisphere.
That is why you call them time series forecasting. The hemispheres are divided daily, weekly and monthly.
DOL has its own hemisphere, WOL has its own hemisphere,and MOL has its own hemisphere.
So our homework daily is to:
1. Watch how price "make a statement" or show its "value intent" when they are in the hemispheres. Deep experience is need to read the interplay between these hemispheres
2. Target 50 pips using 4H swings (looks like interbank targets too so we have backing by riding with their targets)
Lines in trading.. Like all aspects of trading books could be written just on the subject of lines and how to use them. As Viktor said and we all know pictures say alot. And as I had mentioned to Viktor statements etc can all be fudged and altered.... But what cant be altered is the charts...So if you want to learn or understand better or entertain different ideas charts of others are great tools. So here are some charts that lay out 2 hard set data points. Time and Price... Now time is set in stone..The opens of the London Stock Market and the...
Ignored
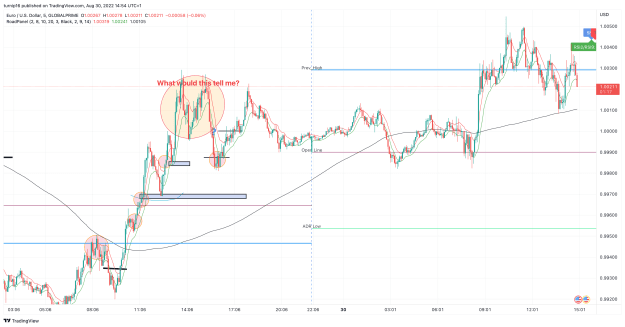
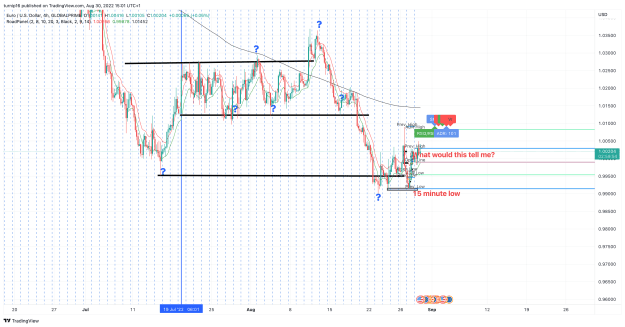
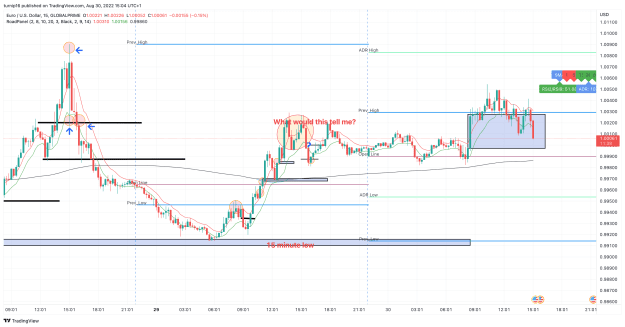
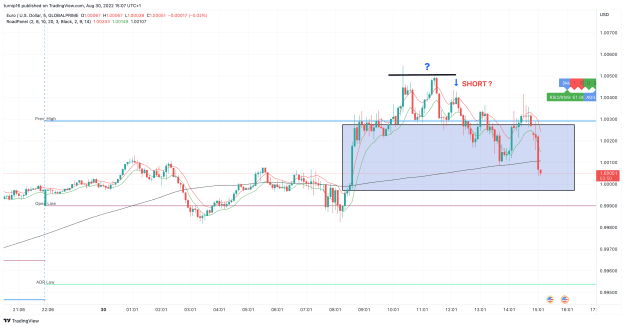
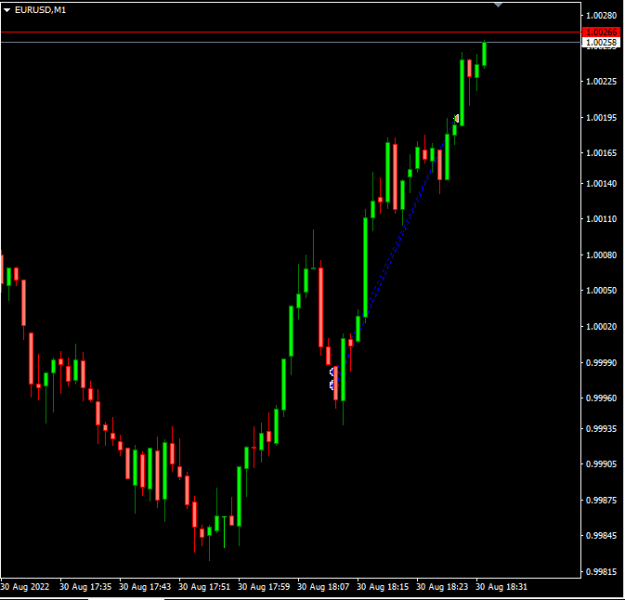
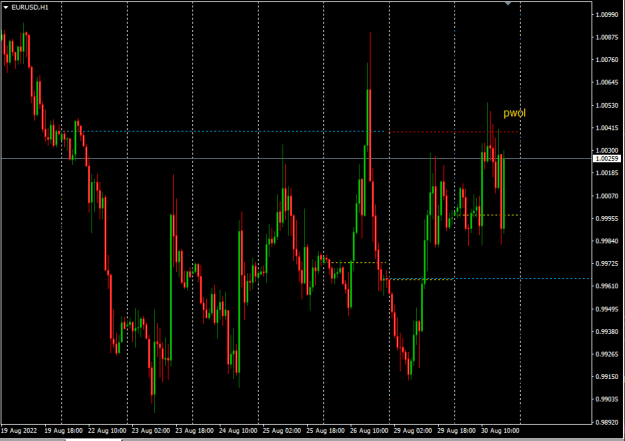
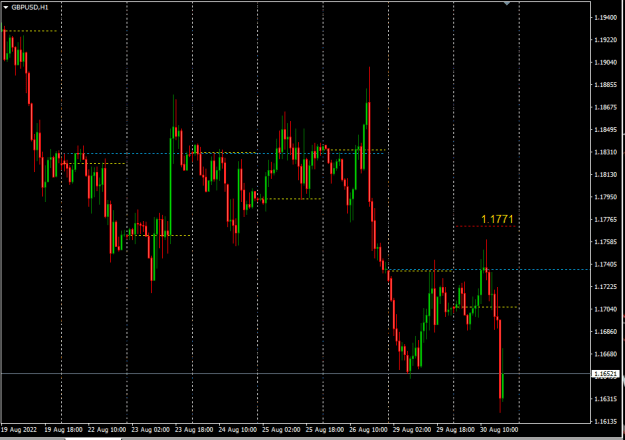
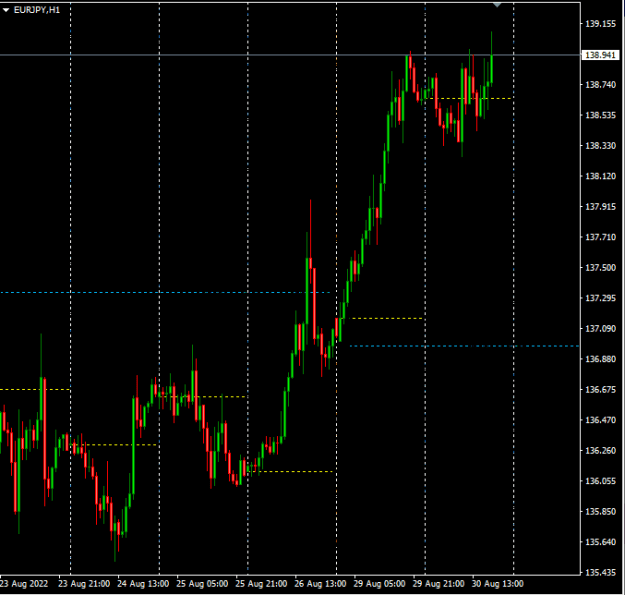
I got some lines that I have noticed but not sure how to interpret yet albeit I have a basic idea. They are formations and price travel/bounces to past levels. The 15 and 5 minute seem a good working double act ( 5 minute is the execution level) whereas the 4 hour has provided a good base for bounces? I would welcome comment on them.
The lightbulb flickers intermittently lighting up new areas as I read more from the contributions on this thread.
{quote} Hi FMA, no I don't use MP. Besides the open lines and adr for expansion projection and calibration, this buy and sell hemisphere is important in my strategy. Market flip from buy to sell hemisphere that's time based in clear demarcation. Just that traders don't see them even though they experience it everyday. Look back at the charts I posted earlier, you see my trades are at or close to this change of hemisphere. The problem with identifying this hemispheres is 3 fold. Such hemispheres are mostly long and protracted, however they lose proper...
Ignored
Thanks for clarifying with the 3rd paragraph. I get what you mean. Thank you for posting the charts, very informative. Perhaps 50 pips is not a bad target everyday.
Now my next problem is the intent (perhaps what you mean is the gap and fade at fair value?) Although the no-brainer buy when above sell when below is a good picture of it, do candle stick patterns matter here?
{quote} I got some lines that I have noticed but not sure how to interpret yet albeit I have a basic idea. They are formations and price travel/bounces to past levels. The 15 and 5 minute seem a good working double act ( 5 minute is the execution level) whereas the 4 hour has provided a good base for bounces? I would welcome comment on them. The lightbulb flickers intermittently lighting up new areas as I read more from the contributions on this thread. {image} {image} {image} {image}
Ignored
I think I may have answered my own questions except whether or not my entry arrows are timely or late. ( Fourth chart down)?
{quote} This was my one line simple comment early today. Bottom pic shows how market plays out as expected. {quote} This is the final trade for the day. I do scalp for 20pips depends on the time of the day which is pretty late for me. {image} {image}
Ignored
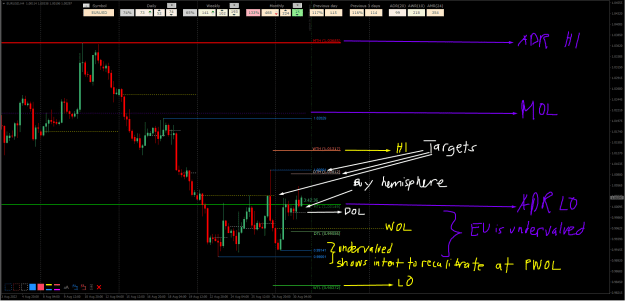
Thanks. I also bought at DOL and TP around the open of previous H4 candle. Looks like EU is crunched in between and will oscillate as ADR is seemingly exhausted and targets already reached.
{quote} This was my one line simple comment early today. Bottom pic shows how market plays out as expected. {quote} This is the final trade for the day. I do scalp for 20pips depends on the time of the day which is pretty late for me. GU in the last pic. {quote} {image} {image} {image}
Ignored
GU tried to re-calibrate but cannot even reach the bisection between two WOL so the sell hemisphere is dominating? Definitely a sell there.
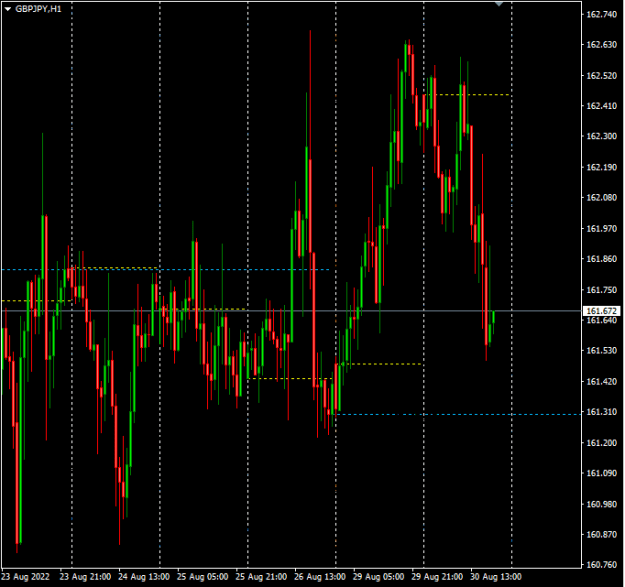
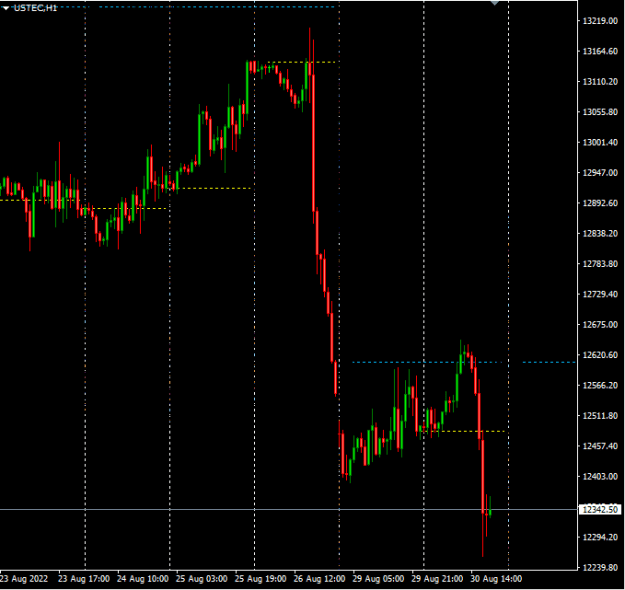
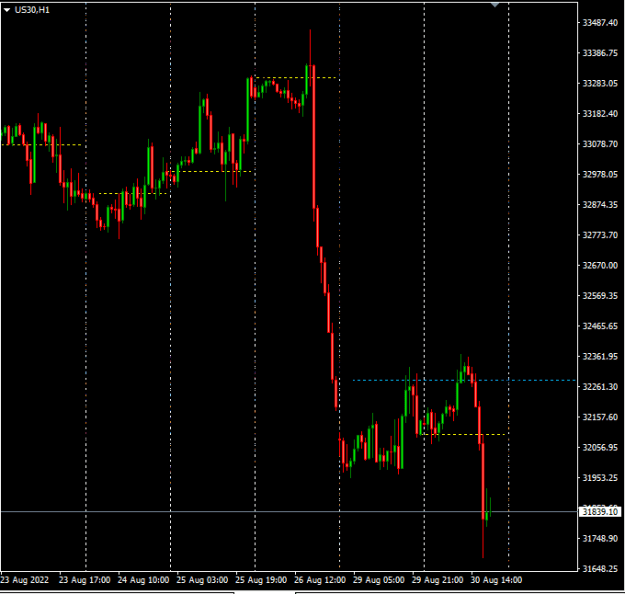
I made sure I added and underlined this comment. I am certain you will see this play out today market. Take a look at nasdaq and US30. There's none of the usual ob/os spike. These markets had no option since yesterday. These markets rise cautiously towards the bearish value zone which market fell through like a rock on Friday after Powell's speech. Expect oscillation between these 2 levels until a breakout happens, 12750 and 32500. Watch closely today.
Ignored
This was a no option chart analysis known ahead of time. Both the rise from the open and the fall from bearish value zone were clear. The 2 levels set for oscillation.
GU tried to re-calibrate but cannot even reach the bisection between two WOL so the sell hemisphere is dominating? Definitely a sell there.
Ignored
When you use the word definite, you mean there's no option left for the market. That's when you place the trade.
Read my comments and my earlier posts. They tie in as you watch the chart, makes it more meaningful. The best is if you watch the market real time, write down your real time analysis.
Perfect practise makes perfect.
With more experience you can tell ahead of time the value intent.
{quote} Hi handy148, let me explain abit about the open lines indicator that fit our requirement. For most of the open line indicators, they don't do 2 things - 1. They don't plot beyond current candle in smaller timeframe. 2. They plot only current candle, no lookbacks. The first pic is Nih98 indicator. The 2nd pic open lines indicator. So I had to use Nih98 indicator for this purpose. Use the open line plot, remove the rest. And if you're looking for adr history plot, I posted R4M indicator here. https://www.forexfactory.com/thread/...9#post13104989...
{quote} When you use the word definite, you mean there's no option left for the market. That's when you place the trade. Read my comments and my earlier posts. They tie in as you watch the chart, makes it more meaningful. The best is if you watch the market real time, write down your real time analysis. Perfect practise makes perfect. With more experience you can tell ahead of time the value intent. https://youtube.com/shorts/btFf42q-ETc?feature=share
Ignored
Thanks for highlighting that to me, now I know my entries with 100% confidence.