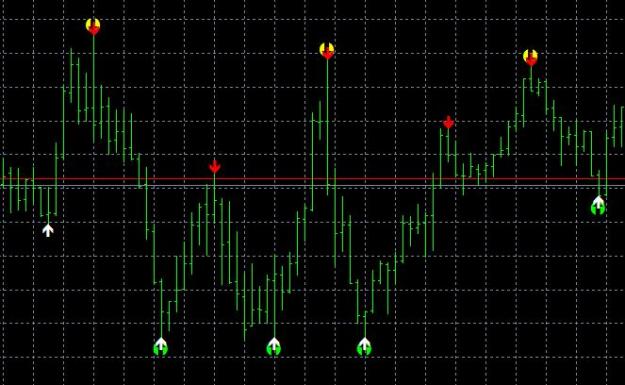
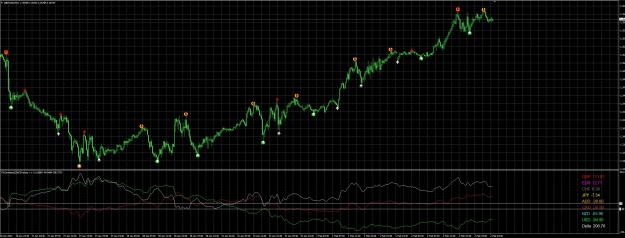
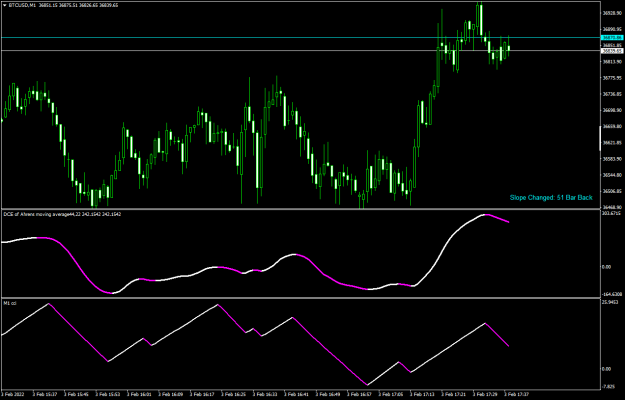
Disliked{quote} i'm tired typing code right now. this version is not completed for order manager yet, i'll continue later just check the 3 buttons (hide/show) rectangle lRect = Long Rectangle (for Buylimit only) mRect = Middle Rectangle (for buystop/sellstop) sRect = Short Rectangle (for SellLimit only) {file} {image}Ignored
I like your concept of printing rectangular shadows on top, middle, bottom for help in decision making.
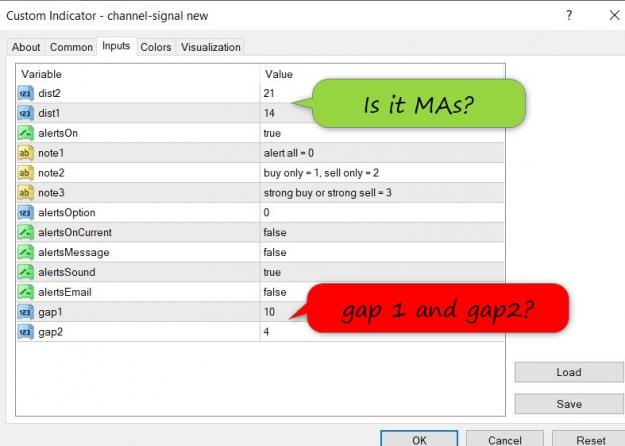
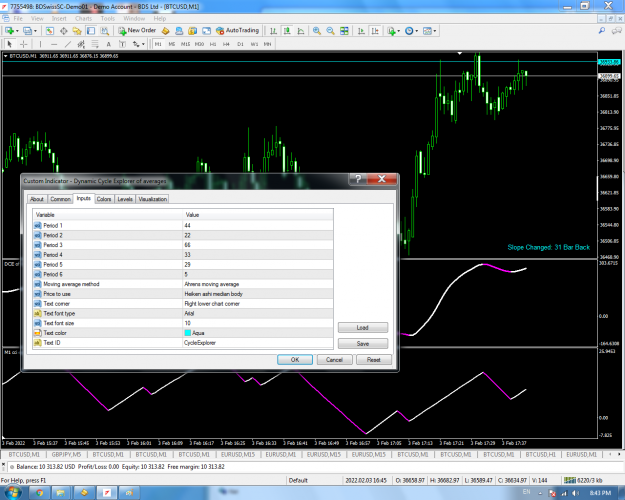
If convenient for you, can you please provide mql5 indicator to get an idea of your porting it to mql4.
What I do manually is :
1. Locate Sideways or Breakout probability based on my experience and probability statistics generated.
Probability of pullbacks, probability of continuation, probability of reversals.
No technical indicators can forecast whether it is going to be sideways or breakout. History statistics can give an idea for making assumptions.
In trading, you can only make assumptions.
2. I use Master Grid and Mini Grid concept. Select a Range for Master grid with its TP and Equity Loss. Define number of mini grids in between the Master Grid with own TP (SL is not used)
For Buy: Top Long will be TP line and Bottom of it for the Equity Loss. For Sell the order is reversed. Top Rally for Equity Loss and Bottom Rally for Profit Taking.
3. For mini grids each with a TP only I use my own Start Price to draw grids of Pending Orders above and below it. If the price is not input, it will default to the current market price.
4. There could be two Steps above Start Price and 6 steps below Start Price. All left to me . Each step could have either constant lot size or the weightage increased by more than 1 number of constant size. I don't trade Martingale but when I feel the breakout is going to happen I will trade top HP with more lots (say 6 lots). If I feel it is going to be Sideways affair, I will choose to have steps with equal-sized lots.
5. I use Pending Order lines to make changes by dragging the lines on the screen . Mouse facility will be welcome.
6. MT5 facilitates Data window which could be hidden or displayed on the screen by way of Tabs .
7. Buttons may be for Selection of Start and Close time, Lots, Steps of Pending Lines, Delete Pending Orders (all buy , all sell, or ALL) , Close Market Orders (with profit , with loss) CLOSE ALL pending orders as well as Market orders or Close all with Stop Time. An option to open TP for revisits . In my experience during compressed consolidation, sometimes the price positions are revisited even 50 times in a period of H4. Each revisit after taking TP should be able to reopen TP on revisits for
8. EA has a symbol as well as magic number plus comments line for inputs.
9.Simple risk management to be activated by Trailing Profit and Breakeven, Drawdown control by Margin % .
Data Window
1. General Data window to show Pips from Open, Trades open: Long, short , Average price for sells and buys, Trades completed, Balance and the equity, Margin%, Current Profit, all profit for today,Pips from Daily Open, ADR from Open, Day Range , Today's daily high range.
2. Trades Data window shows movements between Pending Orders and TP by highlight the grid dynamically and records number of revisits made and Pips generated by revisits only.
Practice makes a person perfect