Greetings coders,
I'm hoping one of you may be able to help me with enhancing the indicator below: (apologies, I don't know how to attach just the link)
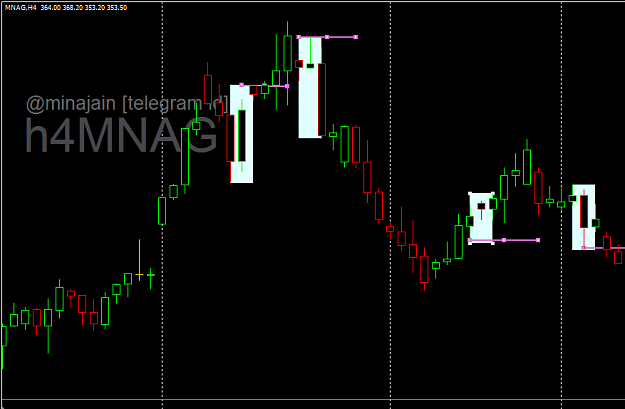
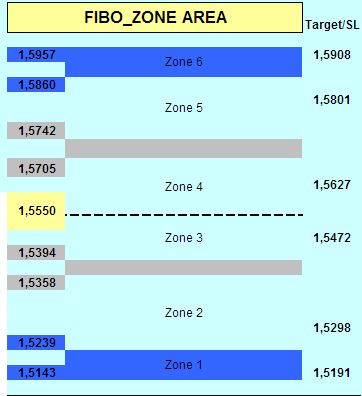
This indicator draws the Hi, Lo and midline of a given timeframe. I would like to have options added that would permit adding more lines indicating 25%, 75%, 125%, 25% below the Lo, 50% below the Lo, etc. Almost like Fibo lines indicator included with Metatrader where one can add user defined values...Hope I am clear.
Thanks very much in advance.
KiS_Avg_Custom.mq4 |
//+------------------------------------------------------------------+
#property indicator_chart_window
#property indicator_buffers 3
#property indicator_color1 MediumOrchid
#property indicator_color2 Aqua
#property indicator_color3 MediumOrchid
//---- indicator buffers
double ExtMapBuffer1[];
double ExtMapBuffer2[];
double ExtMapBuffer3[];
extern string Time_Frame_value = "TimeFrame(0,M1,M5,M15,M30,H1,H4,D1,W1,MN1)";
extern string Time_Frame = "MN1";
int timeFrame;
//+------------------------------------------------------------------+
//| Custom indicator initialization function |
//+------------------------------------------------------------------+
int init() {
if (Time_Frame == "M1") {
timeFrame = PERIOD_M1;
} else if (Time_Frame == "M5") {
timeFrame = PERIOD_M5;
} else if (Time_Frame == "M15") {
timeFrame = PERIOD_M15;
} else if (Time_Frame == "M30") {
timeFrame = PERIOD_M30;
} else if (Time_Frame == "H1") {
timeFrame = PERIOD_H1;
} else if (Time_Frame == "H4") {
timeFrame = PERIOD_H4;
} else if (Time_Frame == "D1") {
timeFrame = PERIOD_D1;
} else if (Time_Frame == "W1") {
timeFrame = PERIOD_W1;
} else if (Time_Frame == "MN1") {
timeFrame = PERIOD_MN1;
} else {
timeFrame = 0;
}
if (timeFrame < Period()) {
Alert("The timeframe must be higher than the current");
deinit();
}
SetIndexBuffer(0, ExtMapBuffer1);
SetIndexStyle(0, DRAW_LINE);
SetIndexBuffer(1, ExtMapBuffer2);
SetIndexStyle(1, DRAW_LINE);
SetIndexBuffer(2, ExtMapBuffer3);
SetIndexStyle(2, DRAW_LINE);
return(0);
}
//+------------------------------------------------------------------+
//| Custom indicator deinitialization function |
//+------------------------------------------------------------------+
int deinit() {
Comment("");
return(0);
}
//+------------------------------------------------------------------+
//| Custom indicator iteration function |
//+------------------------------------------------------------------+
int start() {
int shift, i, CurDay, BarCount;
double DayMax, DayMin;
double DayOpen, DayClose, Avg;
for (shift=Bars-1; shift>=0; shift--) {
int timeFrameIndex = iBarShift(NULL, timeFrame, Time[shift], true);
if (CurDay != iTime(NULL, timeFrame, timeFrameIndex)) {
for (i=BarCount; i>=0; i--) {
ExtMapBuffer1[shift+i] = DayMax;
ExtMapBuffer2[shift+i] = (DayMax+DayMin)/2;
ExtMapBuffer3[shift+i] = DayMin;
}
CurDay = iTime(NULL, timeFrame, timeFrameIndex);
BarCount = 0;
DayMax = 0;
DayMin = 1000;
DayOpen = Open[shift];
}
if (DayMax < High[shift]) {
DayMax = High[shift];
}
if (DayMin > Low[shift]) {
DayMin = Low[shift];
}
BarCount = BarCount + 1;
}
for (i=BarCount; i>=0; i--) {
ExtMapBuffer1[shift+i] = DayMax;
ExtMapBuffer2[shift+i] = (DayMax+DayMin)/2;
ExtMapBuffer3[shift+i] = DayMin;
}
DayClose = Close[0];
Avg = (DayMax+DayMin)/2;
return(0);
}
//+------------------------------------------------------------------+
I'm hoping one of you may be able to help me with enhancing the indicator below: (apologies, I don't know how to attach just the link)
This indicator draws the Hi, Lo and midline of a given timeframe. I would like to have options added that would permit adding more lines indicating 25%, 75%, 125%, 25% below the Lo, 50% below the Lo, etc. Almost like Fibo lines indicator included with Metatrader where one can add user defined values...Hope I am clear.
Thanks very much in advance.
KiS_Avg_Custom.mq4 |
//+------------------------------------------------------------------+
#property indicator_chart_window
#property indicator_buffers 3
#property indicator_color1 MediumOrchid
#property indicator_color2 Aqua
#property indicator_color3 MediumOrchid
//---- indicator buffers
double ExtMapBuffer1[];
double ExtMapBuffer2[];
double ExtMapBuffer3[];
extern string Time_Frame_value = "TimeFrame(0,M1,M5,M15,M30,H1,H4,D1,W1,MN1)";
extern string Time_Frame = "MN1";
int timeFrame;
//+------------------------------------------------------------------+
//| Custom indicator initialization function |
//+------------------------------------------------------------------+
int init() {
if (Time_Frame == "M1") {
timeFrame = PERIOD_M1;
} else if (Time_Frame == "M5") {
timeFrame = PERIOD_M5;
} else if (Time_Frame == "M15") {
timeFrame = PERIOD_M15;
} else if (Time_Frame == "M30") {
timeFrame = PERIOD_M30;
} else if (Time_Frame == "H1") {
timeFrame = PERIOD_H1;
} else if (Time_Frame == "H4") {
timeFrame = PERIOD_H4;
} else if (Time_Frame == "D1") {
timeFrame = PERIOD_D1;
} else if (Time_Frame == "W1") {
timeFrame = PERIOD_W1;
} else if (Time_Frame == "MN1") {
timeFrame = PERIOD_MN1;
} else {
timeFrame = 0;
}
if (timeFrame < Period()) {
Alert("The timeframe must be higher than the current");
deinit();
}
SetIndexBuffer(0, ExtMapBuffer1);
SetIndexStyle(0, DRAW_LINE);
SetIndexBuffer(1, ExtMapBuffer2);
SetIndexStyle(1, DRAW_LINE);
SetIndexBuffer(2, ExtMapBuffer3);
SetIndexStyle(2, DRAW_LINE);
return(0);
}
//+------------------------------------------------------------------+
//| Custom indicator deinitialization function |
//+------------------------------------------------------------------+
int deinit() {
Comment("");
return(0);
}
//+------------------------------------------------------------------+
//| Custom indicator iteration function |
//+------------------------------------------------------------------+
int start() {
int shift, i, CurDay, BarCount;
double DayMax, DayMin;
double DayOpen, DayClose, Avg;
for (shift=Bars-1; shift>=0; shift--) {
int timeFrameIndex = iBarShift(NULL, timeFrame, Time[shift], true);
if (CurDay != iTime(NULL, timeFrame, timeFrameIndex)) {
for (i=BarCount; i>=0; i--) {
ExtMapBuffer1[shift+i] = DayMax;
ExtMapBuffer2[shift+i] = (DayMax+DayMin)/2;
ExtMapBuffer3[shift+i] = DayMin;
}
CurDay = iTime(NULL, timeFrame, timeFrameIndex);
BarCount = 0;
DayMax = 0;
DayMin = 1000;
DayOpen = Open[shift];
}
if (DayMax < High[shift]) {
DayMax = High[shift];
}
if (DayMin > Low[shift]) {
DayMin = Low[shift];
}
BarCount = BarCount + 1;
}
for (i=BarCount; i>=0; i--) {
ExtMapBuffer1[shift+i] = DayMax;
ExtMapBuffer2[shift+i] = (DayMax+DayMin)/2;
ExtMapBuffer3[shift+i] = DayMin;
}
DayClose = Close[0];
Avg = (DayMax+DayMin)/2;
return(0);
}
//+------------------------------------------------------------------+