DislikedIs there an indicator that tracks how many bullish/bearish candles within a larger candle? So for example 12-5 min candles within a 60 min candle. During the 1st hour 7 of the 12 candles are bearish, the next hour 8 of the 12 candles are bearish. What this could mean is the momentum is building in a direction and could allow one to stay in a trade longer and see when the momentum is slowing down or a possible change in trend is in the works.Ignored
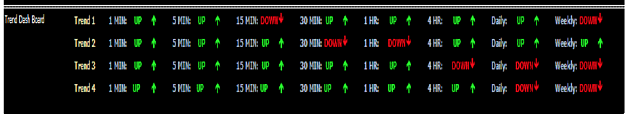
try this. diff from your request but maybe you can use it. it only display for current chart. maybe coders will have an idea from this indicator
Attached File(s)