• Home
  • Forums
  • News
  • Calendar
  • Market
  • Login
  • Join
  • User/Email: Password:
  • 12:33pm
Menu
  • Forums
  • News
  • Calendar
  • Market
  • Login
  • Join
  • 12:33pm
Sister Sites
  • Energy EXCH
  • Crypto Craft
  • Forex Factory

Options

Bookmark Thread

First Page First Unread Last Page Last Post

Print Thread

Similar Threads

Scalping Gold using WPR 877 replies

Which standard Indicators are most related to each other? 2 replies

Gold Mining II - Using Reference Lines 13 replies

An idea for building wealth...using only gold 9 replies

Trading Gold - An End of Day System 27 replies

  • Trading Systems
  • /
  • Reply to Thread
  • Subscribe
  • 1,077
Attachments: Gold Mining - Using Each Trading Day's Trend
Exit Attachments

Gold Mining - Using Each Trading Day's Trend

  • Last Post
  •  
  • 1 130131Page 132133134 209
  • 1 Page 132 209
  •  
  • Post #2,621
  • Quote
  • Jun 26, 2020 11:46am Jun 26, 2020 11:46am
  •  BiteFX
  • Joined Dec 2018 | Status: THE GOLD MINER | 2,752 Posts
Quoting BiteFX
Disliked
{quote} Confirmed... First profit taken... 100pips Another sell waiting at 1755/56 level throughout today. I Stay Alive.
Ignored
No opportunity... I Stay Alive.
Trading is war, STAY ALIVE!!!
 
2
  • Post #2,622
  • Quote
  • Jun 26, 2020 12:03pm Jun 26, 2020 12:03pm
  •  farukh
  • Joined Mar 2014 | Status: Member | 571 Posts
Quoting BiteFX
Disliked
{quote} Nice thoughts Farukh
Ignored
Thanks mate. But things are getting changed now, lets see where the day and week will close.
 
2
  • Post #2,623
  • Quote
  • Jun 29, 2020 3:55am Jun 29, 2020 3:55am
  •  Skoljkica
  • | Additional Username | Joined Nov 2016 | 783 Posts
Morning all.
I am looking prices behavior at 1768.84
Below it I am looking to go short. First support line is at 1760.68 with pullback up to 1764.22 and sell again with TP 1757.15
If 1768.84 becomes support, then buy with TP 1777.73
Always expect unexpected.
 
4
  • Post #2,624
  • Quote
  • Jun 29, 2020 5:40am Jun 29, 2020 5:40am
  •  selym_co
  • Joined Aug 2011 | Status: All the world is a stage... | 839 Posts
Quoting Skoljkica
Disliked
Morning all. I am looking prices behavior at 1768.84 Below it I am looking to go short. First support line is at 1760.68 with pullback up to 1764.22 and sell again with TP 1757.15 If 1768.84 becomes support, then buy with TP 1777.73
Ignored
Good Morning,

I also think in the same way. Although technically I am on the BUY side, I do not expect Bulls to go further. This week we must see some Bears running around the chart. At least that is what my heart expects

Apart from my heart expectations, most of the elements I see on the chart shows North. (Apart from giant monthly SUP&DEM area right above us - If it was a dominant one, price would bounce back so strong. The fact that price spends some time here proves that price desires to penetrate it)

Time will show everything

Best Regards
Imagination rules the world ...
PEPPER - WAVE2 Return This Month: na
 
3
  • Post #2,625
  • Quote
  • Jun 29, 2020 7:06am Jun 29, 2020 7:06am
  •  Skoljkica
  • | Additional Username | Joined Nov 2016 | 783 Posts
Quoting Skoljkica
Disliked
Morning all. I am looking prices behavior at 1768.84 Below it I am looking to go short. First support line is at 1760.68 with pullback up to 1764.22 and sell again with TP 1757.15 If 1768.84 becomes support, then buy with TP 1777.73
Ignored
If price holds 1770.08 or 1768.84 it could go up even further than 1777.73
I wouldn't be surprised if price reaches 1786.09 until tomorrow evening, it would be nice closing of the month.
I'm prepared for both, bulls and bears.
Always expect unexpected.
 
4
  • Post #2,626
  • Quote
  • Jun 29, 2020 9:36am Jun 29, 2020 9:36am
  •  selym_co
  • Joined Aug 2011 | Status: All the world is a stage... | 839 Posts
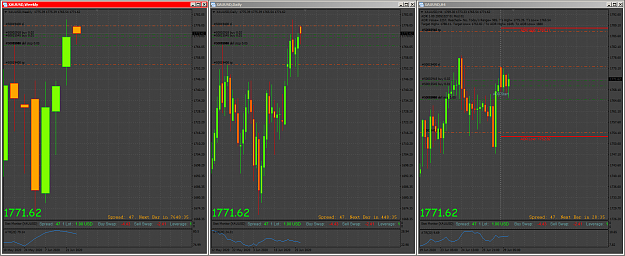
I hope price will chose one direction and go soon. Otherwise, it is so annoying to watch it shaking up and down and not choosing one direction. Oh, God, how can it be so annoying????

Daily Range in the north is something like 1788 (i hope)
Daily Range in the south is something like 1752 (i hope)

Best Regards
Attached Image (click to enlarge)
Click to Enlarge

Name: xauusd.PNG
Size: 112 KB
Imagination rules the world ...
PEPPER - WAVE2 Return This Month: na
 
3
  • Post #2,627
  • Quote
  • Jun 29, 2020 2:17pm Jun 29, 2020 2:17pm
  •  rayoub
  • Joined Mar 2020 | Status: Member | 1,512 Posts
Hey all just wanna say good trading week to you all, will post trade idea today when it closes, but the theme ive had for the day is to buy 1765-1768 area, possibly seeing it go to 1777.50 area before maybe going down, but 1768 has been super stubborn so expecting a rise
 
3
  • Post #2,628
  • Quote
  • Jun 29, 2020 2:18pm Jun 29, 2020 2:18pm
  •  rayoub
  • Joined Mar 2020 | Status: Member | 1,512 Posts
Quoting Skoljkica
Disliked
{quote} If price holds 1770.08 or 1768.84 it could go up even further than 1777.73 I wouldn't be surprised if price reaches 1786.09 until tomorrow evening, it would be nice closing of the month. I'm prepared for both, bulls and bears.
Ignored
I am seeing 1792 , even potentially 1802 as week and month resistance area, bulls seem undeterred at this point lol
 
3
  • Post #2,629
  • Quote
  • Edited at 6:22pm Jun 29, 2020 5:47pm | Edited at 6:22pm
  •  BiteFX
  • Joined Dec 2018 | Status: THE GOLD MINER | 2,752 Posts
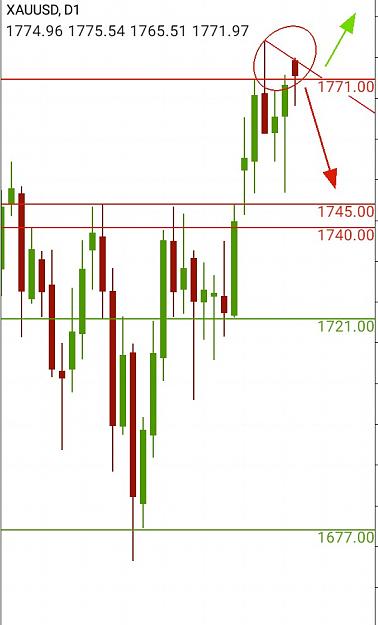
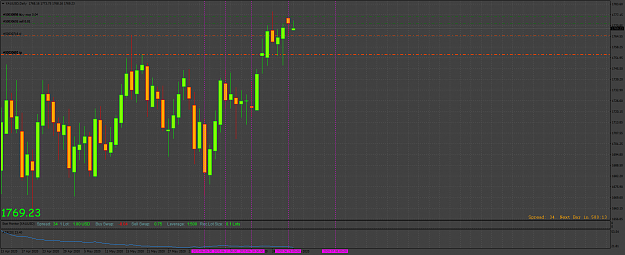
Trade Idea for Tuesday June 30, 2020.
Observations:
1. The high of last week Wednesday's dark cloud cover is yet to be erased by the bulls.
2. Three line break pattern from 19th to 23rd created a resistance at 1771. The dark cloud cover closed below that level on the 24th.
3. Hanging man line last week Friday the 26th, signaling a bearish reversal closed below that level.
4. Another hanging man line formed today 29th, closed above 1771, signaling a bearish reversal, but not necessarily a change of trend.

Other levels am watching are on the chart.

Action: am selling below 1771, but a break above 1779 invalidates the signal. And antigravity continues.

Pro Tip: Money grows on the tree of patience..."and" multiplies by proper risk managment.

We Stay Alive...
Attached Image (click to enlarge)
Click to Enlarge

Name: IMG_20200629_222509.jpg
Size: 64 KB
Trading is war, STAY ALIVE!!!
 
3
  • Post #2,630
  • Quote
  • Jun 30, 2020 1:08am Jun 30, 2020 1:08am
  •  rayoub
  • Joined Mar 2020 | Status: Member | 1,512 Posts
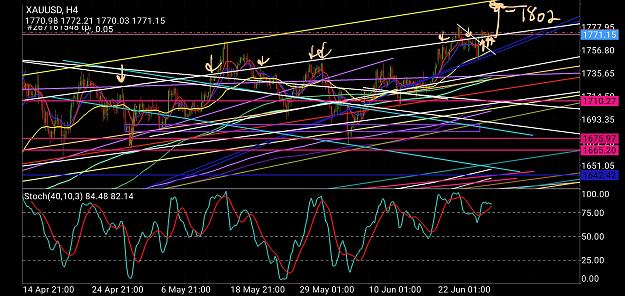
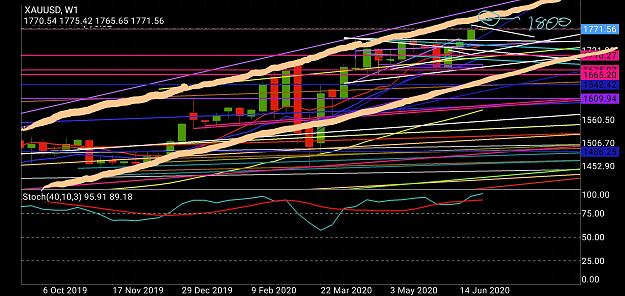
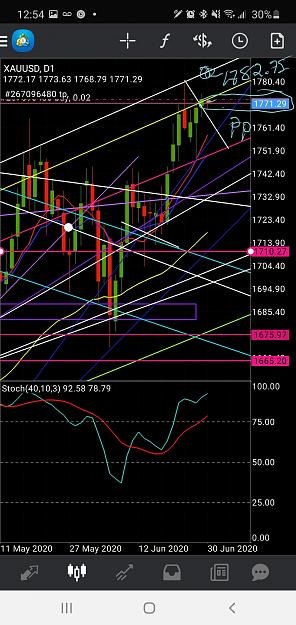
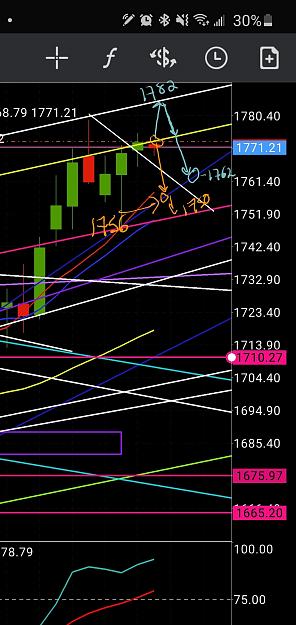
Trade ideas for today,
price has been consolidating between upper 1760s and lower 1770s,. daily pivot stands around 1771 as bite has indicated above.
I am looking to buy 1767 where our S1 stands and 1771. tp will be 1776, 1781. extending to 1802.
if price finds resistance at 1781, will look to short there down to 1762, around weekly pivot area.
Attached Images (click to enlarge)
Click to Enlarge

Name: Screenshot_20200630-004126_MetaTrader 4.jpg
Size: 1.8 MB Click to Enlarge

Name: Screenshot_20200630-004716_MetaTrader 4.jpg
Size: 1.5 MB Click to Enlarge

Name: Screenshot_20200630-005706_MetaTrader 4.jpg
Size: 1.2 MB Click to Enlarge

Name: Screenshot_20200630-010159_MetaTrader 4.jpg
Size: 640 KB
 
4
  • Post #2,631
  • Quote
  • Jun 30, 2020 1:10am Jun 30, 2020 1:10am
  •  rayoub
  • Joined Mar 2020 | Status: Member | 1,512 Posts
if price breaks below 1771 and closes below it comfortably, will look for a sell from there to around 1762, 1756.. but I have a slight bias towards bulls, await market judgment
 
2
  • Post #2,632
  • Quote
  • Jun 30, 2020 1:14am Jun 30, 2020 1:14am
  •  rayoub
  • Joined Mar 2020 | Status: Member | 1,512 Posts
Quoting BiteFX
Disliked
Trade Idea for Tuesday June 30, 2020. Observations: 1. The high of last week Wednesday's dark cloud cover is yet to be erased by the bulls. 2. Three line break pattern from 19th to 23rd created a resistance at 1771. The dark cloud cover closed below that level on the 24th. 3. Hanging man line last week Friday the 26th, signaling a bearish reversal closed below that level. 4. Another hanging man line formed today 29th, closed above 1771, signaling a bearish reversal, but not necessarily a change of trend. Other levels am watching are on the chart....
Ignored
bite is there a reason why your daily candle for yesterday looks as so? I'm assuming price opened with a gap up yesterday? but just asking because I do see your hanging man, just not showing up on mine or trading view so was just wondering.
 
1
  • Post #2,633
  • Quote
  • Jun 30, 2020 1:29am Jun 30, 2020 1:29am
  •  BiteFX
  • Joined Dec 2018 | Status: THE GOLD MINER | 2,752 Posts
Quoting rayoub
Disliked
{quote} bite is there a reason why your daily candle for yesterday looks as so? I'm assuming price opened with a gap up yesterday? but just asking because I do see your hanging man, just not showing up on mine or trading view so was just wondering.
Ignored
Yours looks a spinning top... An evening star formation. The signal is still the same unless market invalidates it.
I have observed long ago, different brokers have different candles, I just interpret the one from the broker am using brother.
Trading is war, STAY ALIVE!!!
 
2
  • Post #2,634
  • Quote
  • Jun 30, 2020 1:43am Jun 30, 2020 1:43am
  •  BiteFX
  • Joined Dec 2018 | Status: THE GOLD MINER | 2,752 Posts
Quoting rayoub
Disliked
{quote} bite is there a reason why your daily candle for yesterday looks as so? I'm assuming price opened with a gap up yesterday? but just asking because I do see your hanging man, just not showing up on mine or trading view so was just wondering.
Ignored
I have checked up with trading view, its a spinning top, metals mine here has a hanging man... These are no brokers still.
Brother, different candles abound everywhere...
We Stay Alive
Trading is war, STAY ALIVE!!!
 
2
  • Post #2,635
  • Quote
  • Jun 30, 2020 2:57am Jun 30, 2020 2:57am
  •  rayoub
  • Joined Mar 2020 | Status: Member | 1,512 Posts
Quoting BiteFX
Disliked
{quote} I have checked up with trading view, its a spinning top, metals mine here has a hanging man... These are no brokers still. Brother, different candles abound everywhere... We Stay Alive
Ignored
thanks for clarifying bro!ther!.
 
2
  • Post #2,636
  • Quote
  • Edited at 3:51am Jun 30, 2020 3:36am | Edited at 3:51am
  •  BiteFX
  • Joined Dec 2018 | Status: THE GOLD MINER | 2,752 Posts
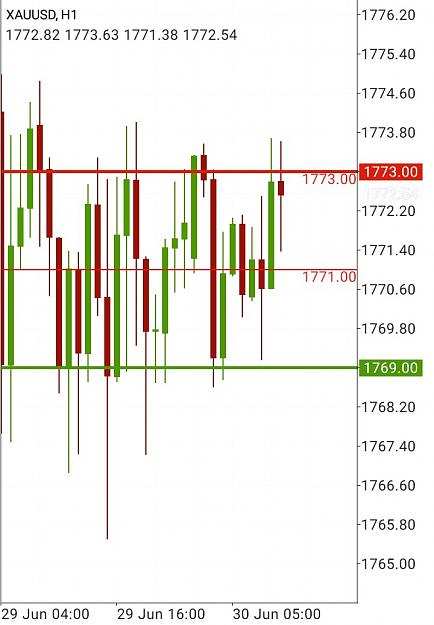
I went down to H1 time frame, the last three candles of yesterday formed three line break pattern.
Their top 1773 is acting so far as a good resistance.
Their bottom 1769 is acting so far as a good support.

A break out is looming. No one knows!
Attached Image (click to enlarge)
Click to Enlarge

Name: IMG_20200630_084920.jpg
Size: 90 KB
Trading is war, STAY ALIVE!!!
 
4
  • Post #2,637
  • Quote
  • Jun 30, 2020 3:58am Jun 30, 2020 3:58am
  •  Skoljkica
  • | Additional Username | Joined Nov 2016 | 783 Posts
Morning all

1777.73 (50% Week Resistance/Support) is first resistance on the way up, but I think it could go even higher to 1786.09 (38.2% Quarter Resistance)
I expect 1771.00/1768.84 to act as a support.
So for me, 1771.00/1768.84 is a place to go long and 1786.09 is a place to short with TP 1780.64,
Always expect unexpected.
 
4
  • Post #2,638
  • Quote
  • Jun 30, 2020 7:23am Jun 30, 2020 7:23am
  •  selym_co
  • Joined Aug 2011 | Status: All the world is a stage... | 839 Posts
Quoting BiteFX
Disliked
A break out is looming. No one knows! {image}
Ignored
Actually according to GANN-based calculations, yesterdays candle was a significant one, which had the potential to be a reversal. And following potential reversal is 9 (business days) days ahead. For now, yesterdays candle seems to be the TOP, but still noone can be sure Market is good at suprising its participants...

Correction: I corrected "7" as "9"
Attached Image (click to enlarge)
Click to Enlarge

Name: XAUUSDDaily.png
Size: 76 KB
Imagination rules the world ...
PEPPER - WAVE2 Return This Month: na
 
2
  • Post #2,639
  • Quote
  • Jun 30, 2020 8:27am Jun 30, 2020 8:27am
  •  BiteFX
  • Joined Dec 2018 | Status: THE GOLD MINER | 2,752 Posts
Quoting BiteFX
Disliked
Trade Idea for Tuesday June 30, 2020. Observations: 1. The high of last week Wednesday's dark cloud cover is yet to be erased by the bulls. 2. Three line break pattern from 19th to 23rd created a resistance at 1771. The dark cloud cover closed below that level on the 24th. 3. Hanging man line last week Friday the 26th, signaling a bearish reversal closed below that level. 4. Another hanging man line formed today 29th, closed above 1771, signaling a bearish reversal, but not necessarily a change of trend. Other levels...
Ignored
Looks like our hanging man is hanging out... We await market judgement...and Stay Alive.
Trading is war, STAY ALIVE!!!
 
2
  • Post #2,640
  • Quote
  • Jun 30, 2020 9:18am Jun 30, 2020 9:18am
  •  rayoub
  • Joined Mar 2020 | Status: Member | 1,512 Posts
Quoting BiteFX
Disliked
{quote} Looks like our hanging man is hanging out... We await market judgement...and Stay Alive.
Ignored
lol I like that. So haven't seen too much going on yet, anticipating that the move we are waiting for will come to light in the next 4hr candle. bunch of catalysts being released then. Still biased towards the bulls, m30 went down to find its 200 ema, stoch is right around 25 level, 1763-1765 is where our weekly pivot and daily s1 and s2 are. on my chart still have gaps left at 1770.30 and 1773. first r1 stands around 1776 as stated in previous post.

us just made a low for the day, but ive noticed they like to make the lows and higus for the day lol so we will see
 
1
  • Trading Systems
  • /
  • Gold Mining - Using Each Trading Day's Trend
  • Reply to Thread
    • 1 130131Page 132133134 209
    • 1 Page 132 209
0 traders viewing now
  • More
Top of Page
  • Facebook
  • Twitter
About MM
  • Mission
  • Products
  • User Guide
  • Blog
  • Contact
MM Products
  • Forums
  • Calendar
  • News
  • Market
MM Website
  • Homepage
  • Search
  • Members
  • Report a Bug
Follow MM
  • Facebook
  • Twitter

MM Sister Sites:

  • Energy EXCH
  • Crypto Craft
  • Forex Factory

Metals Mine™ is a brand of Fair Economy, Inc.

Terms of Service / ©2022