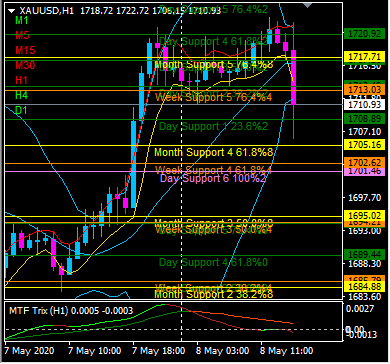
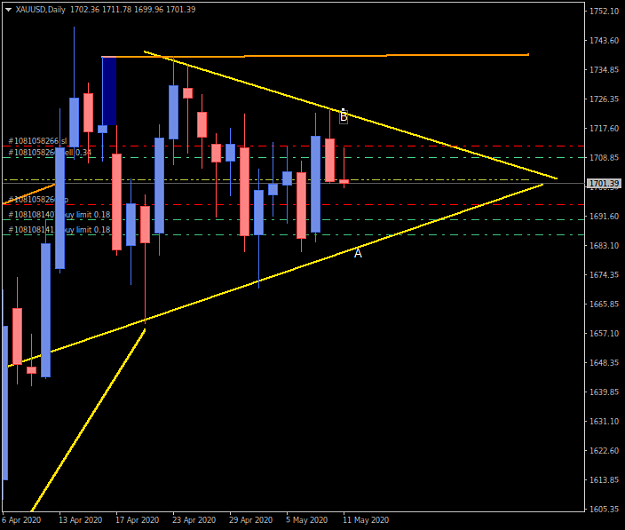
I am expecting bulls to lead the market up to 1729.86, but first pullback down to 1713.03/1708.89 where I am waiting for my entry. Bulls are already exhausted and in range between 1729.86 to 1737.99 there are 3 major resistance lines, so I am expecting price to find resistance there and possible down to 1705.16/1702.62 {image}{image}
Ignored
Let's see is price going to hold 1708.89 and bulls will take over or it will find resistance at 1713.03 and bears will take over.
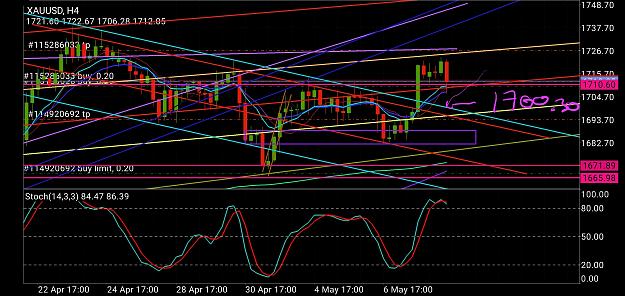
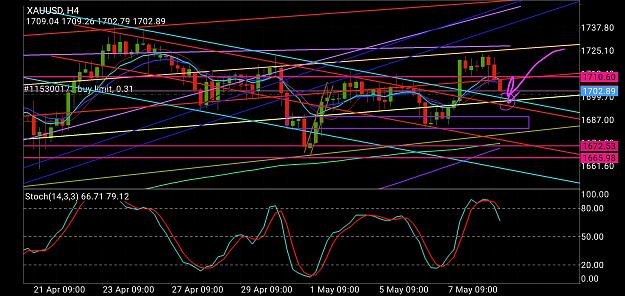
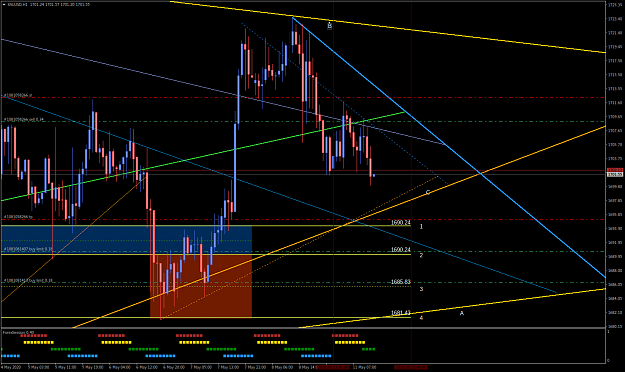
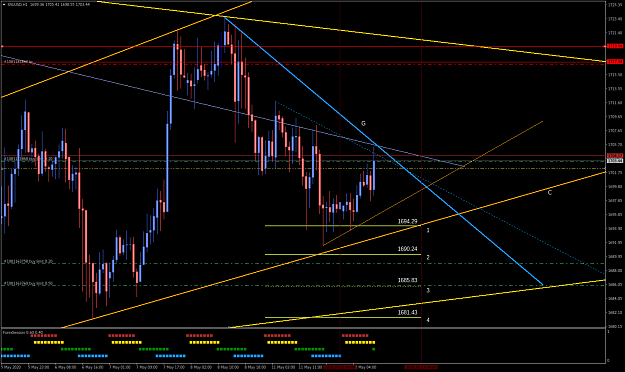
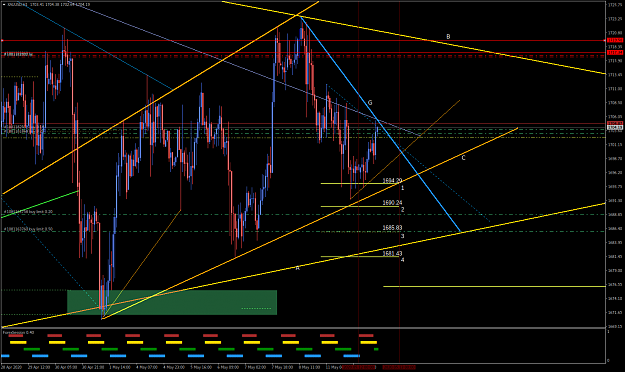
{image} The dark red rectangle is is support area between line 2 and 3 is a pullback area The lighter red rectangle is critical support area and if the price cross the line 1 to down and also cross the green trend line the market will tend to down and try to find a thick orange color trend line A as new support The Two blue rectangles expect as important areas if the price will cross the line level 3 and the golden line near it, then it tend to visit the orange trend line as a resistant Finally if the golden line near the level line 3 will reject...
So after some analyzing and remembering what was talked about yesterday in here taking profits have closed all longs at 1719. price seemed to have difficulty passing that area. Long still intact for me but I would rather take peofits stay alive as BITEFX always reminds us and reinstate a better buy position around 1700 area. No use riding a perfectly good positive to a negative just to have it go back up. collect profits increase capital and we survive. I am done for the day you guys I hope you all have a great weekend. till next time bite skol,and quanta
Used demo acct all week but definitely got confidence back up, sometimes its needed after big loss to get you thinking straight again and know that sometimes shit just doesn't go your way. Markets do what markets do.
Joined Dec 2018
|
Status: Big Operator
|4,525 Posts
Market has been dealing in a wide range...and as such weep-sawing my trades and account balance.
I have not been really happy...This is not Sote.
No good follow through on a move...my time will come.
In all, we should know that no one single trading system thrives in all market condition...So, I Stay Alive.
Ignored
Keep your head up brother. We learn. These losses will teach us to be more profitable. this week I did really well and made a lot of money (however this was solely for the demo acct, nothing added to real acct).... i too have been not so happy with trading performance but we are all here to help each other. as I've been posting I've been reading and learning from other traders as well with combined knowledge we shall be successful.
one valuable thing I learned in other post is to think of each level as a target, once one level is broken where is the next one, combined with our trend lines we can better predict where price should head to each time a resistance or support is broken (once 1723 was not passed 1717 was logical support once breached 1709-1710 became logical once this was breached 1701-1703 looked promising) as such one could quickly reverse their trade once a support is breached and sell down to next support or just wait for buy at support with the previous level as maximum tp) so once 1717 was breached you could sell to 1710 or buy at 17010 and place tp at 1716 for instance ensuring you are at least growing your acct by the end of the day.
we stay alive brother try to relax and enjoy the weekend. opportunities are always there we will get them soon.
{quote} Keep your head up brother. We learn. These losses will teach us to be more profitable. this week I did really well and made a lot of money (however this was solely for the demo acct, nothing added to real acct).... i too have been not so happy with trading performance but we are all here to help each other. as I've been posting I've been reading and learning from other traders as well with combined knowledge we shall be successful. one valuable thing I learned in other post is to think of each level as a target, once one level is broken...
The first support level lenon-colored line No.1 which is 1690.24 and the Area between line 1 and 2 is support area
If the price find the first area as support change the direction I guess the price is going to break golden line B and after a pullback the symmetric triangle complete and new up trend will start, only if it will break the area between 1739 and 1747
If the price break the level line 2 then it going to find a support area between 1685 and 1681 the golden trend line A at below which is the support line of triangle. In my opinion the price will not break this golden trend line because of covid-19 uncertainty. And then the price will try to test the golden line B at above
But everything will possible and if the price cross the golden trend line A and find this line as a resistant then the bear will control the market
|
Additional Username
|
Joined Nov 2016
|783 Posts
Hello everyone.
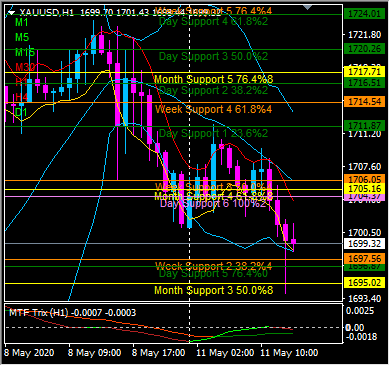
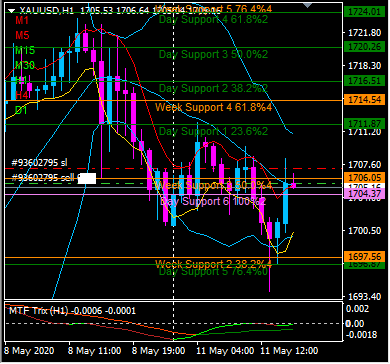
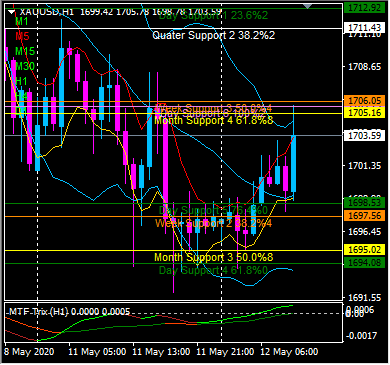
Price couldn't find support at 1706.05/1704.37
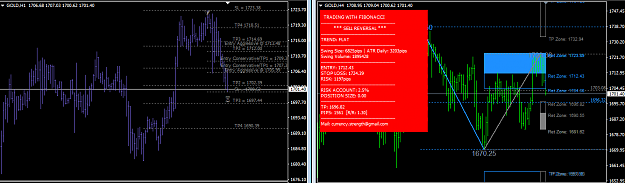
So in the range between 1704.37 and 1706.05 we have 3 strong fibo lines: 1704.37 (100% Day Support/Resistance), 1705.16 (61.8% Month Support) and 1706.05 (50% Week Support/Resistance)
All of them can act as a support or resistance.
If resistance, price could go down to 1695.02/1688.08
If support, price could go up to 1716.51/1725.04
Hello everyone. Price couldn't find support at 1706.05/1704.37 So in the range between 1704.37 and 1706.05 we have 3 strong fibo lines: 1704.37 (100% Day Support/Resistance), 1705.16 (61.8% Month Support) and 1706.05 (50% Week Support/Resistance) All of them can act as a support or resistance. If resistance, price could go down to 1695.02/1688.08 If support, price could go up to 1716.51/1725.04 {image}{image}
Ignored
I'm in!
I don't think bulls have strength to move price higher, maybe one more push.
First support line 1695.02, second 1688.08
Good morning skol and quanta. I agree, seems bulls got rejected quickly from 170 area knocking price back below my trendline which sits around 1706-1708 so same levels as you mentioned skol. think price will find its way to 1688. first target of 1695 seemed to be breached nicely earlier. MAs are also crossing so hopefully nice drop is coming .
|
Additional Username
|
Joined Nov 2016
|783 Posts
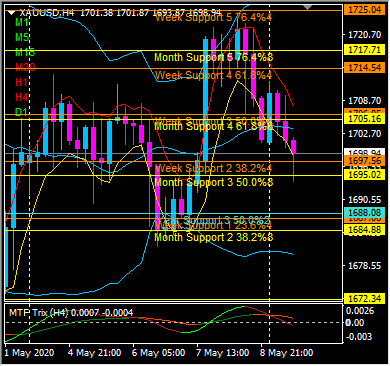
Morning all.
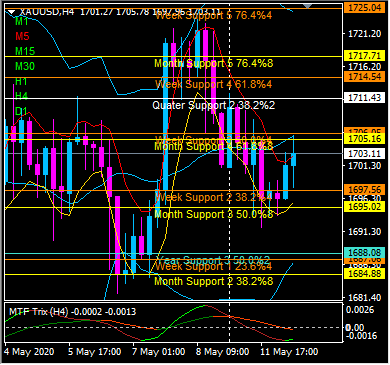
Today the similar scenario as yesterday.
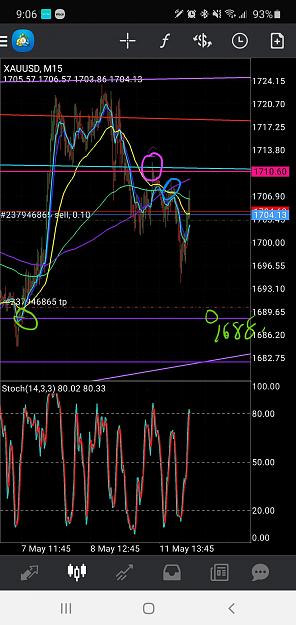
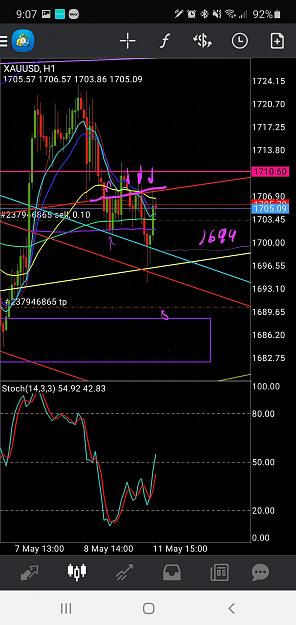
Price is trying to break strong support/resistance cluster in the range between 1705.16 and 1706.05
If failed to break, then bears could push price down to 1688.08/1687.06
If it becomes support, then bulls could push the price up to 1711.43/1717.71/1725.04
Morning all. Today the similar scenario as yesterday. Price is trying to break strong support/resistance cluster in the range between 1705.16 and 1706.05 If failed to break, then bears could push price down to 1688.08/1687.06 If it becomes support, then bulls could push the price up to 1711.43/1717.71/1725.04 {image}{image}
Ignored
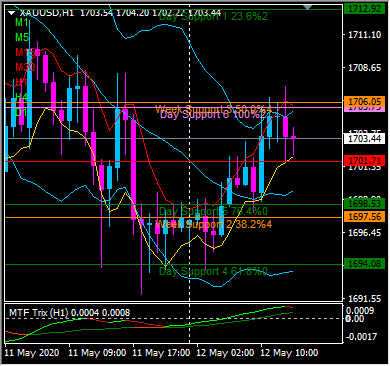
There is still strong battle between bulls and bears around 1705.
Price hardly breaks 1701.71.
It could go wild.