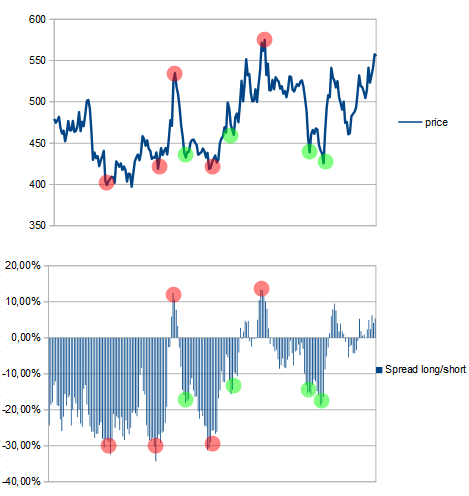
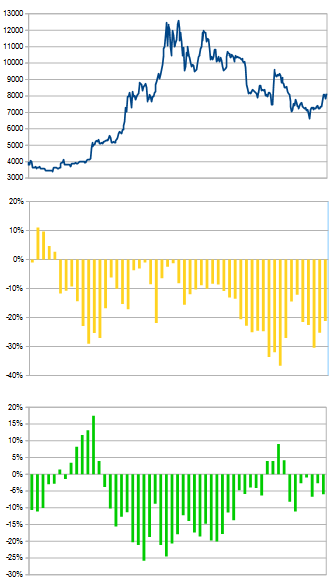
Platinium
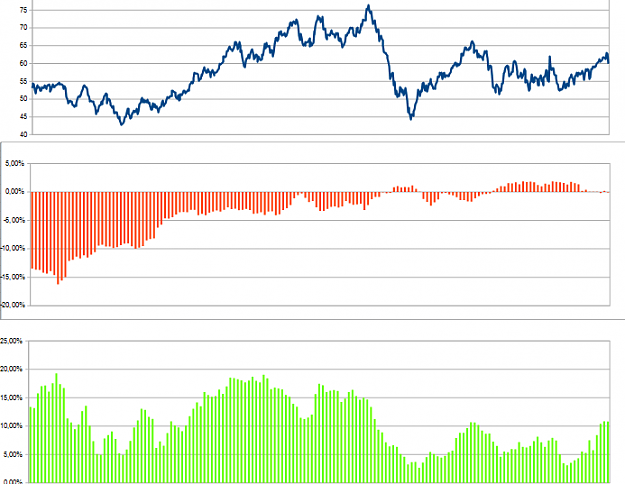
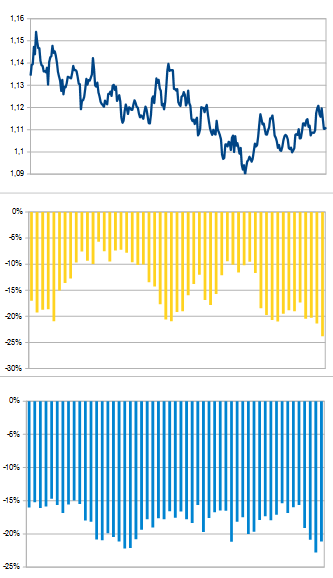
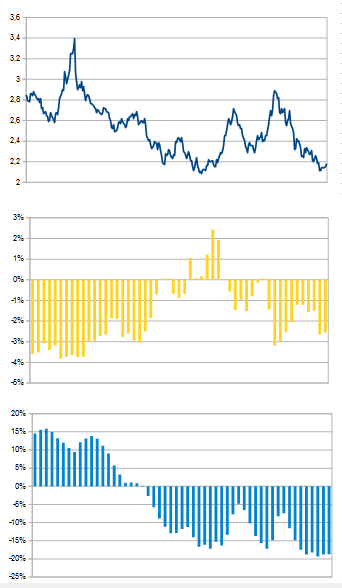
Charts speak for itself.
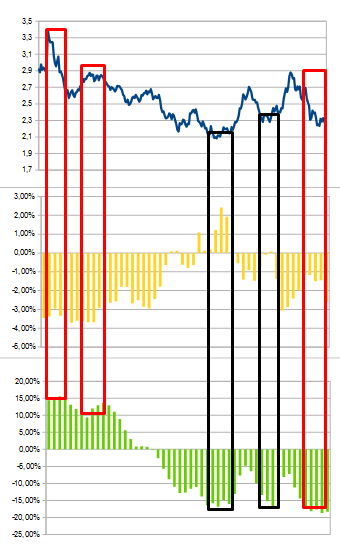
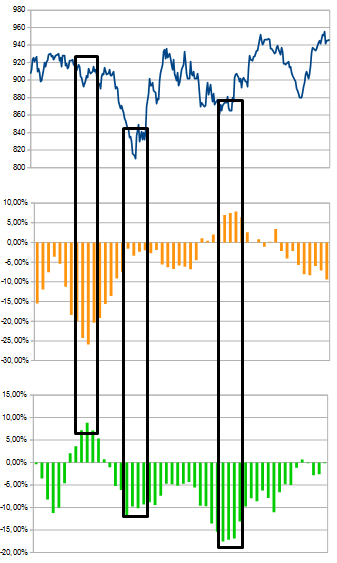
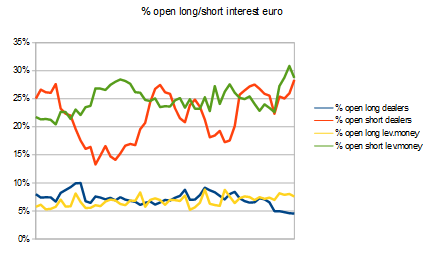
Everytime we had an increase in the net longs from the managed money, we had sell off. History repeats itself ?
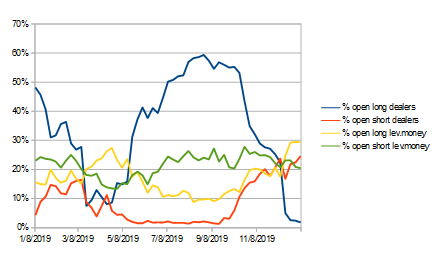
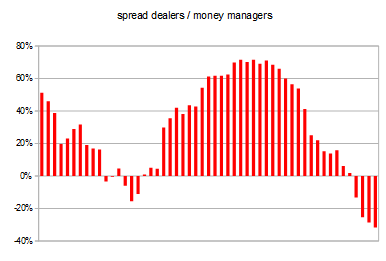
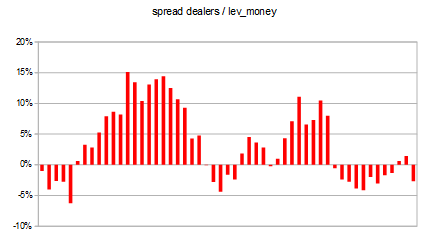
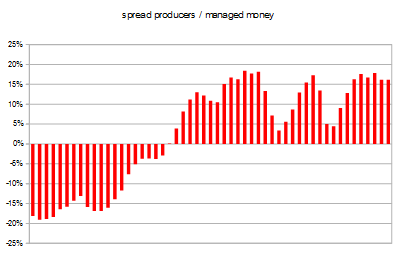
What you can see here? open longs are being increased above 50%, while shorts are being decreased to 5%. Spread is very large
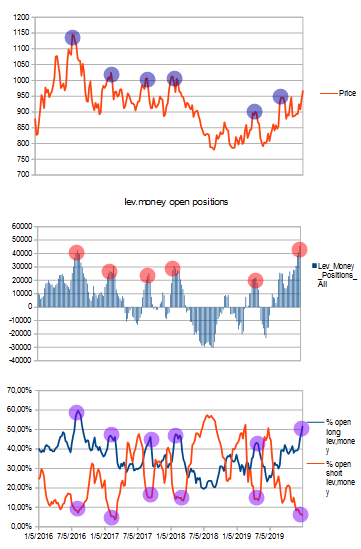
Another point to look at is the strength of the open longs & open shorts. Let me explain.
Whenever the open longs are very important, we can large decline (1st blue point in 2016 & 4th one in 2018).
Whenever the open longs are less important, decline are lesser because they are not enough contrarian longs to bring market down.
Today, open longs are increasing a lot, meaning we could have large decline over the next couple of months.
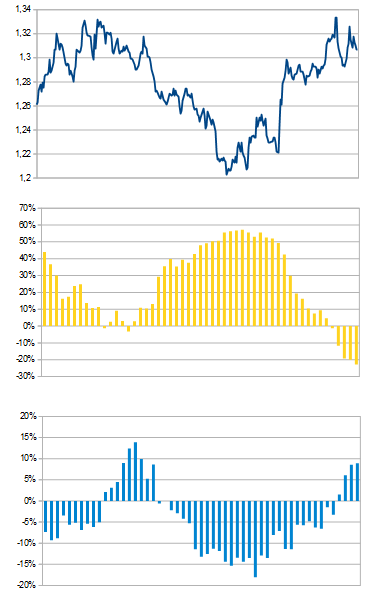
What i don't like is the price structure with higher highs and higher lows.
Price action will be right ? COT will be right ?
Correction in the process for every precious metals or just the start of a bull run ?
Attached Image
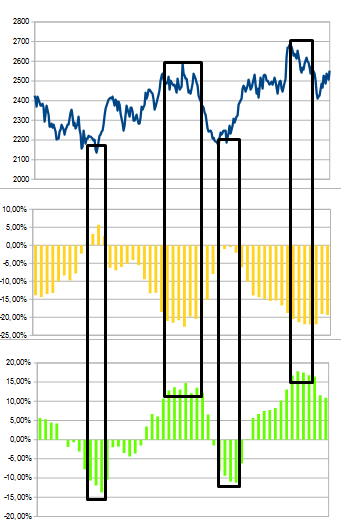
Charts speak for itself.
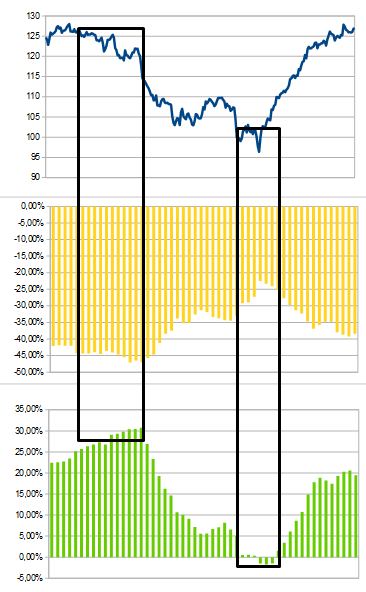
Everytime we had an increase in the net longs from the managed money, we had sell off. History repeats itself ?
What you can see here? open longs are being increased above 50%, while shorts are being decreased to 5%. Spread is very large
Another point to look at is the strength of the open longs & open shorts. Let me explain.
Whenever the open longs are very important, we can large decline (1st blue point in 2016 & 4th one in 2018).
Whenever the open longs are less important, decline are lesser because they are not enough contrarian longs to bring market down.
Today, open longs are increasing a lot, meaning we could have large decline over the next couple of months.
What i don't like is the price structure with higher highs and higher lows.
Price action will be right ? COT will be right ?
Correction in the process for every precious metals or just the start of a bull run ?
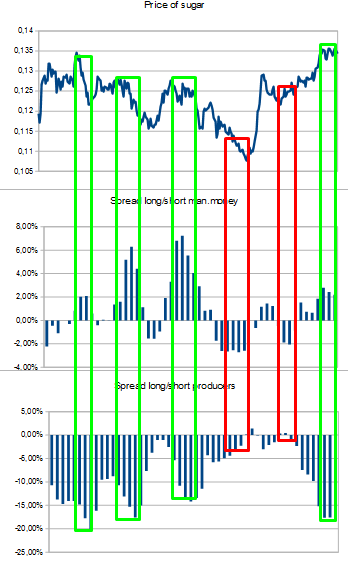
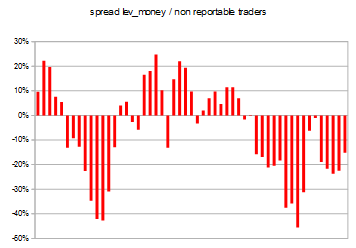
COT: The precious data ignored