{quote} Curious to hear how you are planning to use it. From what I see in the marketplace, it is a valuable skill to have for sure!
Ignored
I'm slowly trying to transition away from Excel. Some of the nested IF statements I'm using are getting a little ridiculous and what I'm doing is probably better coded. Plus, coding has a lot of other use cases beyond data analysis. I studied Python last year, but I've been taking the easy route with Excel instead of using it like I should be. Both Python and R are useful in their own respects and the knowing both is really optimal so that's what I'm aiming for. The discouraging this is, I'm good at Excel and I know it's going to be a long road to get to a similar level of competency in R or Python.
Self-sufficiency is the greatest of all wealth. - Epicurus
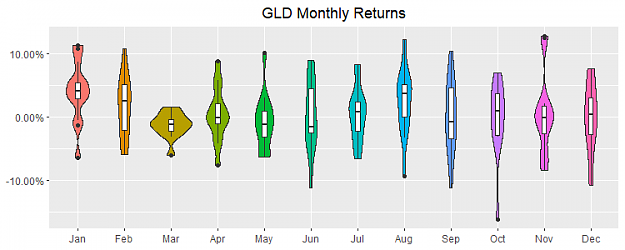
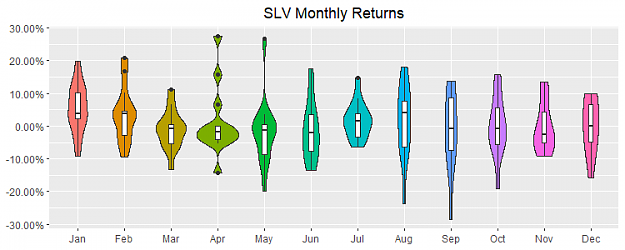
I came across an interesting script to view at seasonal returns using violin charts. Violin charts work like this:
Length of violin represents the max and min returns during the period.
Width of violin represents the frequency of returns. If the widest point of the violin is around 3%, then you know 3% has historically been the most common return.
There's a black dot in the violin that represents the median return.
I like this visualization a lot because instead of just showing the average monthly return, it also shows the distribution of returns.
I decided to run it on GLD and SLV to see how they look. I'm still getting used to this software so bare with me on the graphics, but here are the plots:
Attached Image (click to enlarge)
Attached Image (click to enlarge)
Self-sufficiency is the greatest of all wealth. - Epicurus
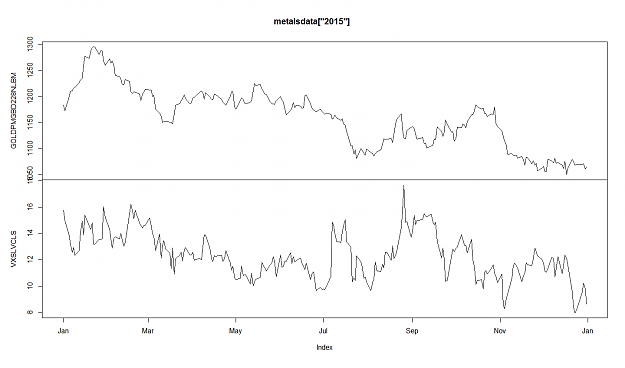
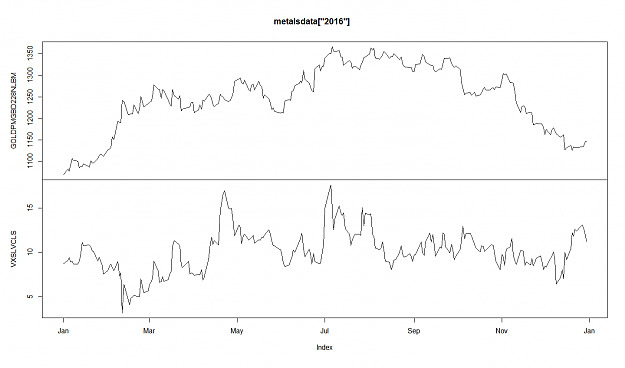
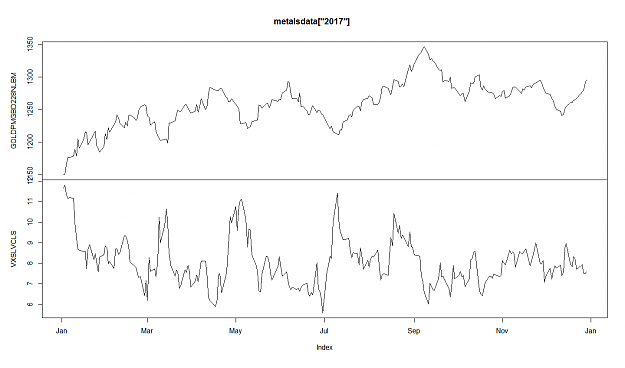
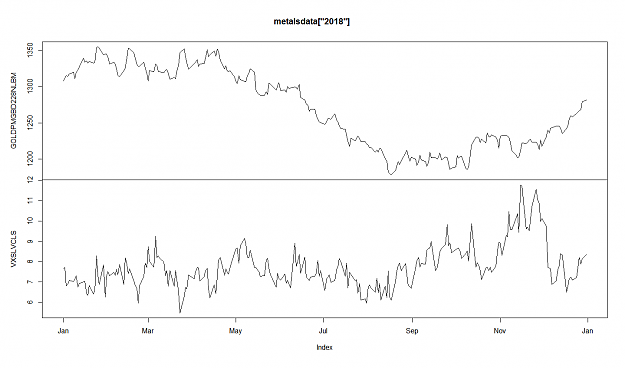
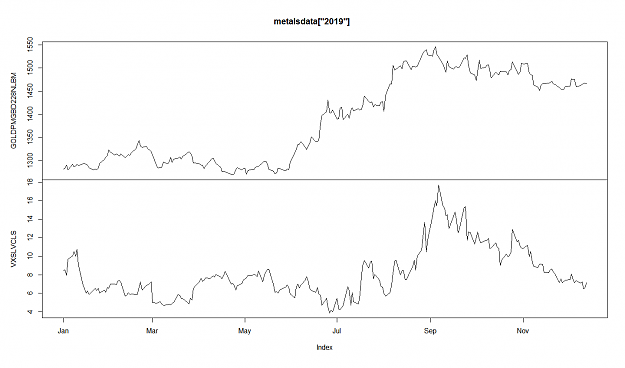
One interest of mine has been volatility indexes like GVZ. Used correctly, I think studying volatility is useful and can offer some predictive value. I routinely use the VIX index to enter into trades so I'm going to see what I can uncover using metals volatility indexes.
First, I did a study to see if there was any predictive value when you compare gold's volatility with silver's volatility. In theory I think an extreme reading might be indicative of a trend change. Unfortunately, comparing gold and silver volatilities didn't yield any valuable insights.
The below charts show gold at the top and silver volatility / gold volatility at the bottom. 2017 and 2019 were kind of interesting, but the other years not so much.
Attached Image (click to enlarge)
Attached Image (click to enlarge)
Attached Image (click to enlarge)
Attached Image (click to enlarge)
Attached Image (click to enlarge)
Self-sufficiency is the greatest of all wealth. - Epicurus
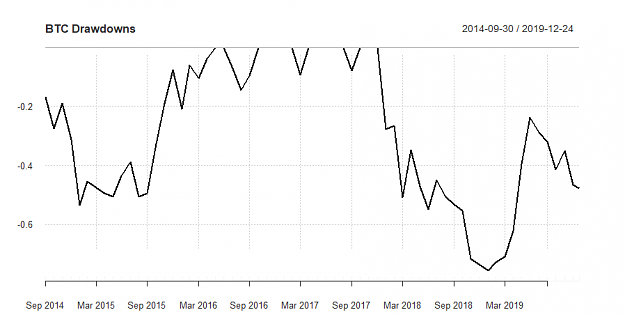
I was going through an R course tonight and saw something pretty neat. With just a few lines of code you can easily calculate and plot drawdowns for any asset or trading strategy. Here's BTC for example:
Attached Image (click to enlarge)
I knew you could calculate this in R, but figured it would take a lot more code. What a great language for finance.
Inserted Code
library(quantmod)
library(PerformanceAnalytics)
btc <- getSymbols("BTC-USD", auto.assign = FALSE)
btc_ret <- periodReturn(btc, period = "monthly")
chart.Drawdown(btc_ret, main = "BTC Drawdowns")
table.Drawdowns(btc_ret)
Self-sufficiency is the greatest of all wealth. - Epicurus