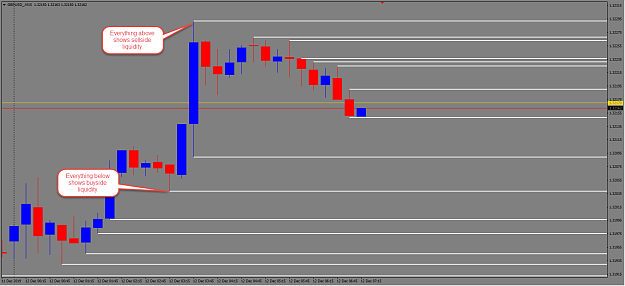
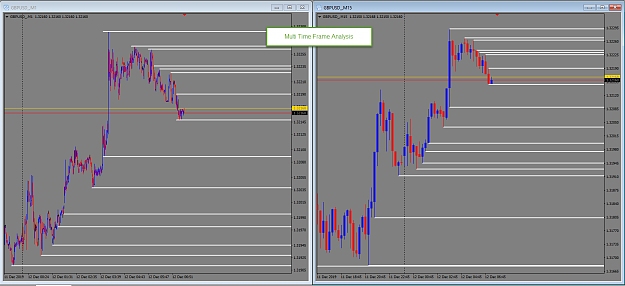
Hello Metatrader, I would like an indicator that will draw a trendline ray at the high and low of each 15M candle. I think the real trick is to remove the trendline when price action has gone through the previous trendline. I would like the line to stay static on the 15M, and show those same trendlines when switching to a lower time frame, like the 1M or 5M. Ideally you would be able to set the time frame of the indicator. e.g. If I set the indicator to use the 1H or 4H as the static time frame, then any time frame lower than that would see those trendlines. I would use this with multi time frame analysis.
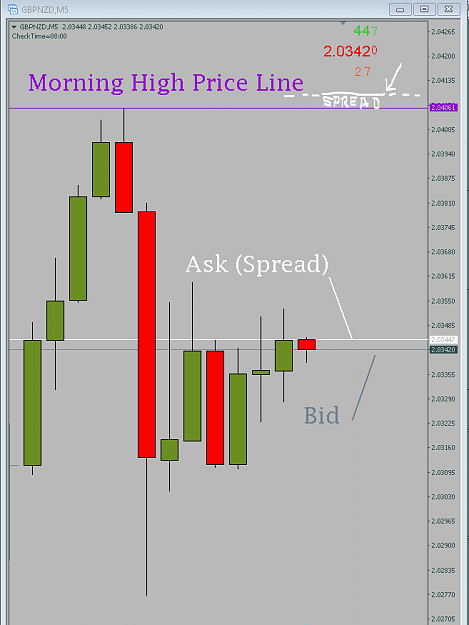
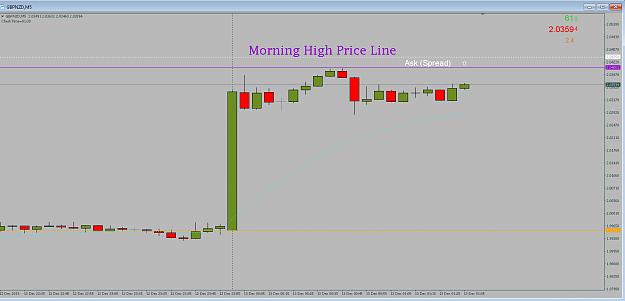
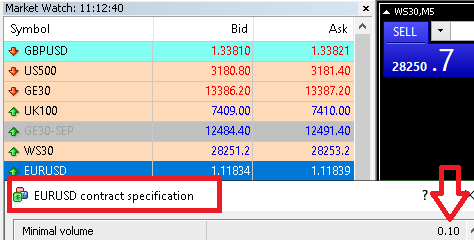
Attached Image(s) (click to enlarge)