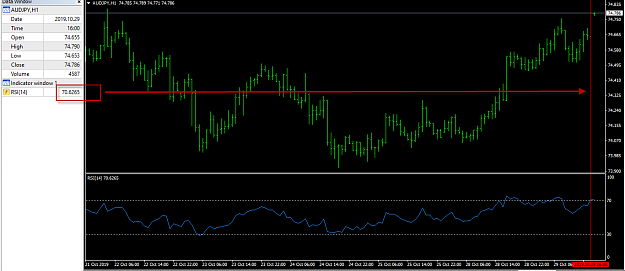
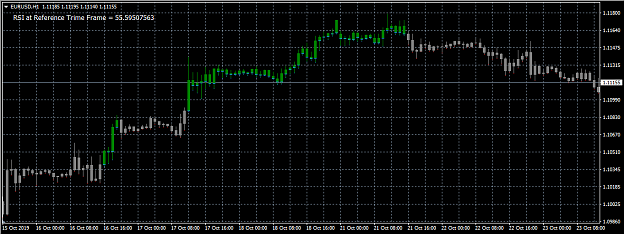
Disliked{quote} {quote} You need take into consideration two scenarios. (1) When you put indicator into a chart it starts evaluating candles of the base chart (M5 - in this example). It will take M5 bar and check value of the RIS for reference time frame (H1 - in this example). So, right now for EUR/AUD: You can see that from: 2019.10.29 - 6:00 till 2019.10.29 - 11:00 RSI on H1 was under 30. There are six candles: 6:00 7:00 8:00 9:00 10:00 11:00 You've got only one value of the RSI for each H1 candle. This is related on base chart (M5) to 6*12=72 bars....Ignored
1