{quote} Hahaha... Yes I have a way of finding my own "PIVOT" levels. Since PIVOT suggests turning point. I go to the Weekly chart and take the Lowest Bearish Bar HIGH of each Swing Low as the Best SELL Levels for the Week and the Highest Bullish Bar LOW as the Best BUY Levels. I also do this on the Daily and Monthly and this gives me a pretty strong idea of the S/R Levels to trade. Hope this explains it. So for example UC just hit the daily SHORT level and sold off and closed strong below a WEEKLY BUY level...meaning likely strong bearish movement...
Ignored
V. cool ... thank you so much for sharing this!
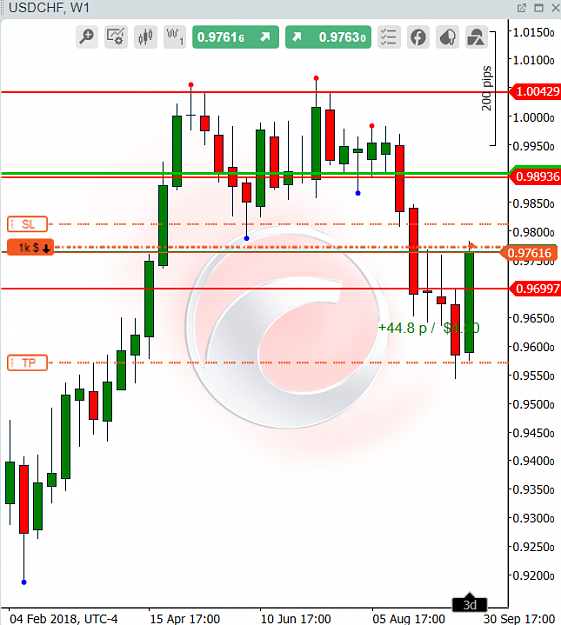
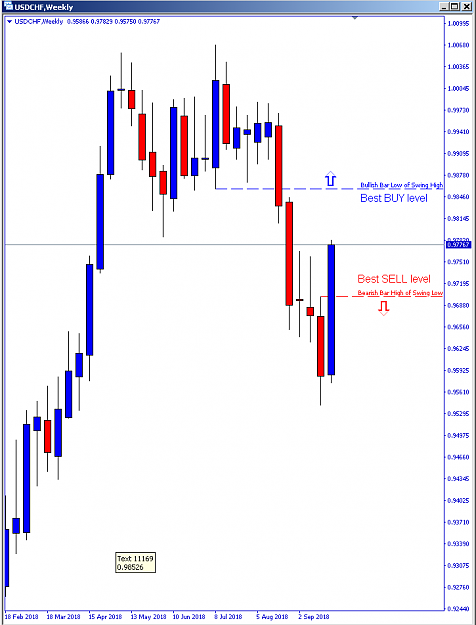
I'm not quite sure I understand how it works yet, so please see attached chart of the USD/CHF Weekly.
Have I marked correctly the Lowest Bearish Bar High of the current Swing Low?
Or do you mean the Lowest Bearish Bar High of the most recent Swing Low above current price action, which would put it at 0.9829?
When you say UC, do you mean USD/CHF? Sorry I don't see the setup you are talking about currently.
{quote} V. cool ... thank you so much for sharing this! I'm not quite sure I understand how it works yet, so please see attached chart of the USD/CHF Weekly. Have I marked correctly the Lowest Bearish Bar High of the current Swing Low? Or do you mean the Lowest Bearish Bar High of the most recent Swing Low above current price action, which would put it at 0.9829? When you say UC, do you mean USD/CHF? Sorry I don't see the setup you are talking about currently. Thanks, Paul {image}
Ignored
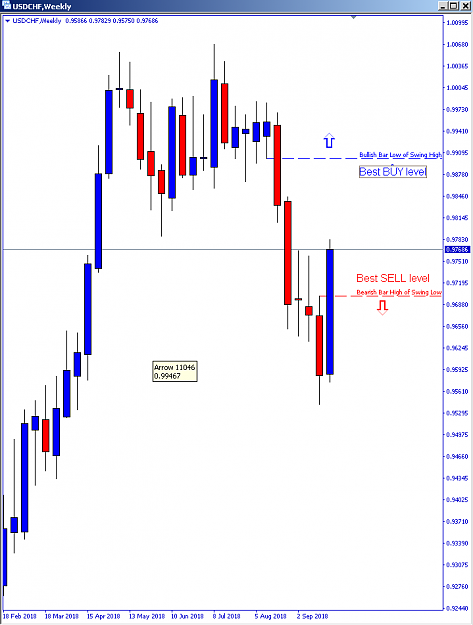
Hi Paul,
Yes you have marked the level correctly. Also look at previous weeks/days/monthly levels within the current price zone.
{quote} Hi Paul, Yes you have marked the level correctly. Also look at previous weeks/days/monthly levels within the current price zone.
Ignored
OK, thanks.
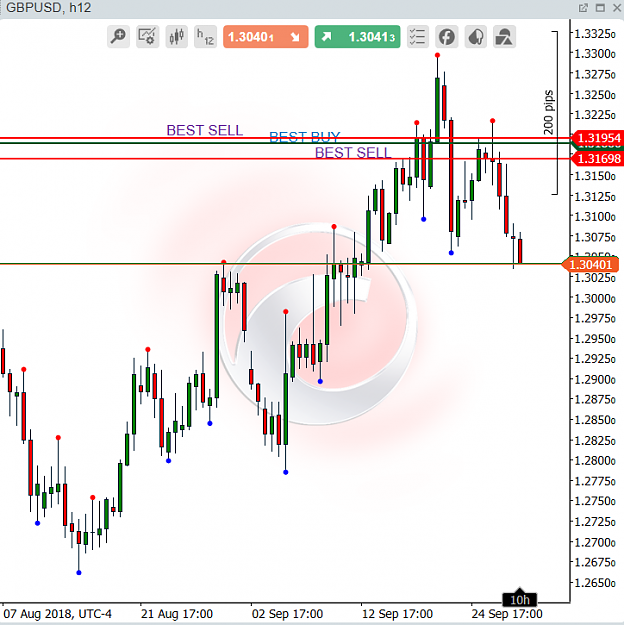
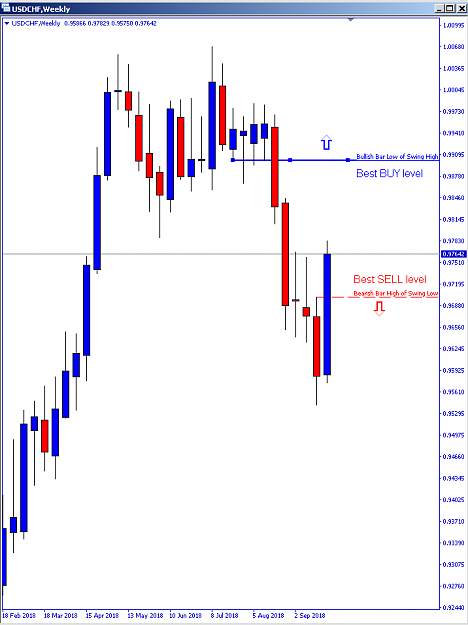
So, I presume that the equivalent Best BUY Level is the is the Highest Bullish Bar Low of the current Swing High - have I marked this one correctly, please?
And you carry out a similar analysis on Daily, Weekly, and Monthly to get a multi-timeframe perspective, showing the Best Buy and Best Sell levels on each one?
{quote} OK, thanks. So, I presume that the equivalent Best BUY Level is the is the Highest Bullish Bar Low of the current Swing High - have I marked this one correctly, please? And you carry out a similar analysis on Daily, Weekly, and Monthly to get a multi-timeframe perspective, showing the Best Buy and Best Sell levels on each one? Thanks again, Paul {image}
Ignored
Yes the HIGHEST BULLISH BAR LOW. In your snapshot you have picked the wrong low. Yes the same goes for the other timeframes. It is also great to use on H4 for adding positions or entries.
{quote} Yes the HIGHEST BULLISH BAR LOW. In your snapshot you have picked the wrong low. Yes the same goes for the other timeframes. It is also great to use on H4 for adding positions or entries.
Ignored
Thanks, I misunderstood.
Do I now understand correctly that you mean the HIGHEST LOW of a BULLISH BAR in the most recent Swing High?
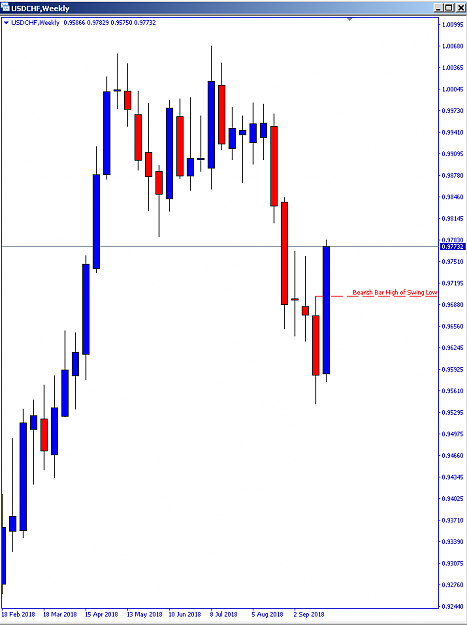
{quote} Thanks, I misunderstood. Do I now understand correctly that you mean the HIGHEST LOW of a BULLISH BAR in the most recent Swing High? As marked on the attached chart? Thanks, Paul {image}
Ignored
Sorry Paul, eyes fixed on US Politics
That's the Highest Bullish Bar Low in the SWING HIGH STRUCTURE (consists of 5 bars)
{quote} OK, so the Highest Bullish Bar Low in the 5-bar Swing High structure, do I understand? In which case, have I now marked this correctly in the attached chart, please? And presumably the Lowest Bearish Bar High in a 5-bar Swing Low structure for Best SELL level? Thanks, Paul {image}
And, for the avoidance of doubt, when choosing which Swing High and which Swing Low to consider, we choose :
1. The highest current COMPLETED SWING HIGH.
2. The lowest current COMPLETED SWING LOW.
where "COMPLETED" means that the 5 bars in the swing pattern have all closed?
In other words we don't consider as-yet-incomplete Swing High or Swing Low patterns, until all 5 bars have closed?
I am trying to use the Fractal indicator to help me visualise which swing patterns are completed and which are not.
Sorry to be so pedantic, but I am trying to use the precise definition to make sure I understand your Weekly USD/CHF sample chart's Green and Red levels, to make sure I can go through the same process on other charts.
Thank you so much for all your assistance with this .. this is all great stuff!
{quote} Thanks, Simone! And, for the avoidance of doubt, when choosing which Swing High and which Swing Low to consider, we choose : 1. The highest current COMPLETED SWING HIGH. 2. The lowest current COMPLETED SWING LOW. where "COMPLETED" means that the 5 bars in the swing pattern have all closed? In other words we don't consider as-yet-incomplete Swing High or Swing Low patterns, until all 5 bars have closed? I am trying to use the Fractal indicator to help me visualise which swing patterns are completed and which are not. Sorry to be so pedantic,...
Ignored
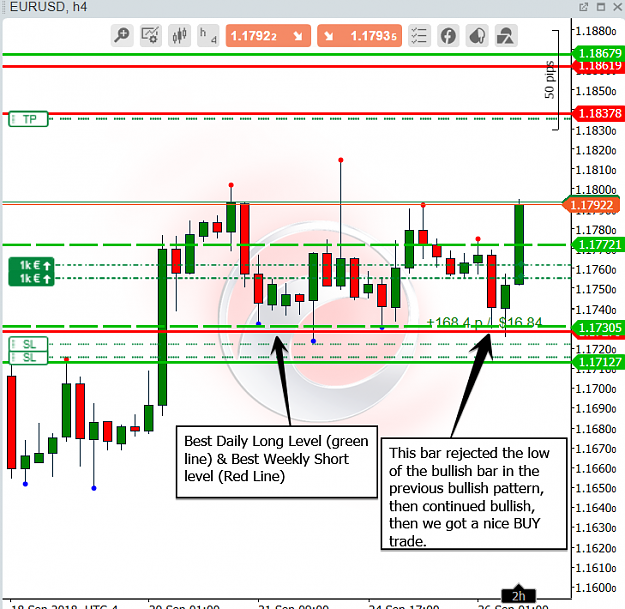
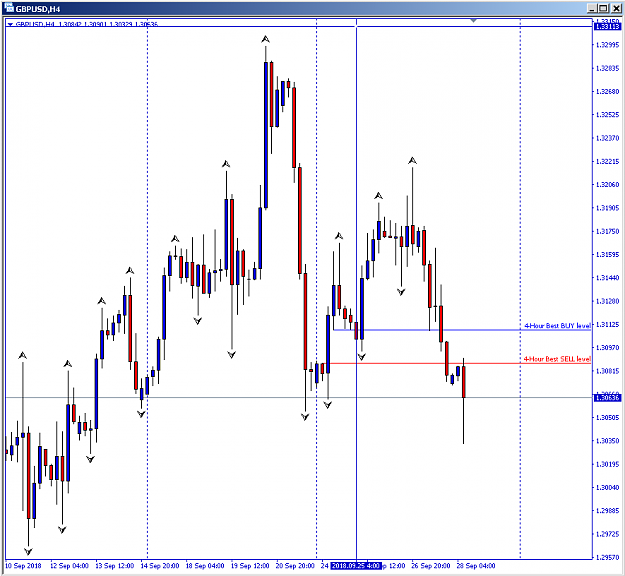
I actually mark ALL the weekly and monthly levels within the trading range. Even daily, you can adjust this as you see fit. But these levels are very much respected so I keep them on my charts to make decisions. To get a good idea of what I am saying, check out how buying and selling continues at these levels on an H4 chart (using H4 chart levels) and you will see.
Yes we need the 5 bars to close to confirm the Swing low or high.
Fractals help a whole lot with easily picking the levels. If you are using Metatrader search under Bill Williams Indicators.
For me the red levels mean selling can continue strongly from here or buying can continue strongly from here. So Based on the PA I place my trades.
{quote} I actually mark ALL the weekly and monthly levels within the trading range. Even daily, you can adjust this as you see fit. But these levels are very much respected so I keep them on my charts to make decisions. To get a good idea of what I am saying, check out how buying and selling continues at these levels on an H4 chart (using H4 chart levels) and you will see. Yes we need the 5 bars to close to confirm the Swing low or high. Fractals help a whole lot with easily picking the levels. If you are using Metatrader search under Bill Williams...
Ignored
Cool, thanks Simone!
Yes, I'm already using the Bill Williams Fractal indicator on MT4, helps a lot.
Thanks for the 190.2% Fibo level tip .. now, that's one Fibo level I am not familiar with at all - I know the usual 127.2, 161.8, 200, 261.8 extensions, of course.
And thank you so much for the Lowest Bearish High / Highest Bullish Low S + R level tip!!! I'm marking my charts up right now in preparation for London opening in a couple of hours time.
I guess in trading with these levels, you just mark them on your charts and see how PA reacts when it gets to those levels.
I assume they also highlight possible turning points for new Swing Highs / Lows.
Whether PA ends up respecting or instead fading the level, it tells you where price is likely to react, one way or the other, which is very useful information!
{quote} Cool, thanks Simone! Yes, I'm already using the Bill Williams Fractal indicator on MT4, helps a lot. Thanks for the 190.2% Fibo level tip .. now, that's one Fibo level I am not familiar with at all - I know the usual 127.2, 161.8, 200, 261.8 extensions, of course. And thank you so much for the Lowest Bearish High / Highest Bullish Low S + R level tip!!! I'm marking my charts up right now in preparation for London opening in a couple of hours time. I guess in trading with these levels, you just mark them on your charts and see how PA reacts...
Ignored
Hi Paul, yes we watch the PA at the levels and trade accordingly. Scott Carney teaches on 190.2 as a significant extension.