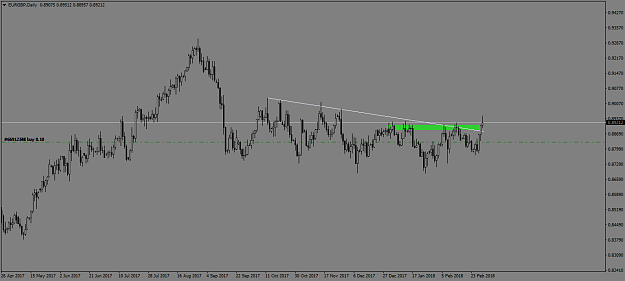
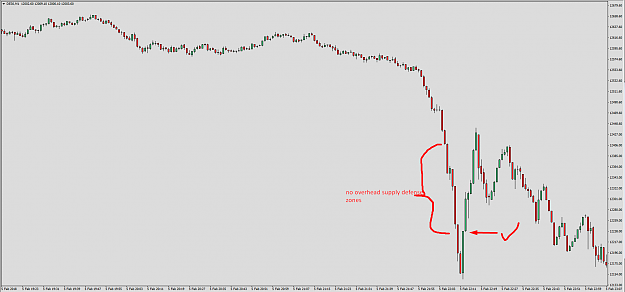
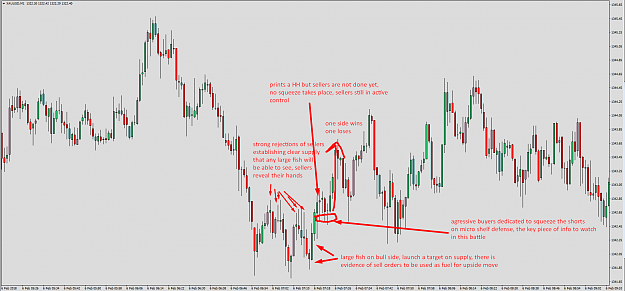
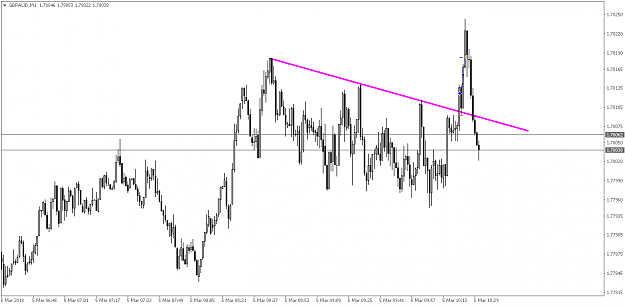
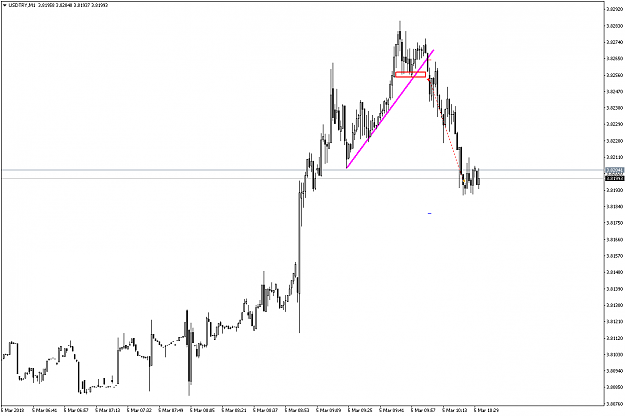
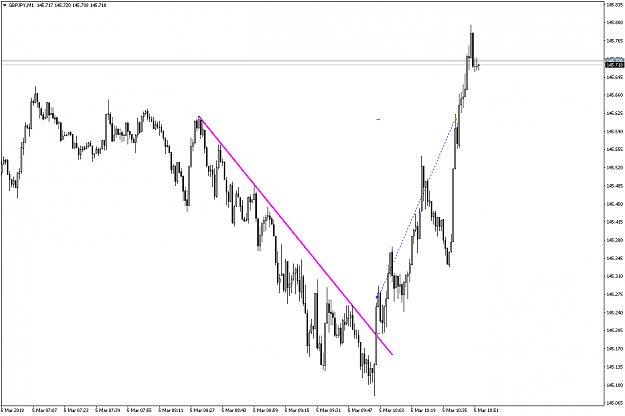
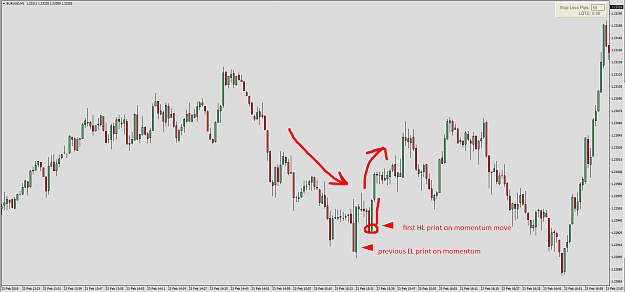
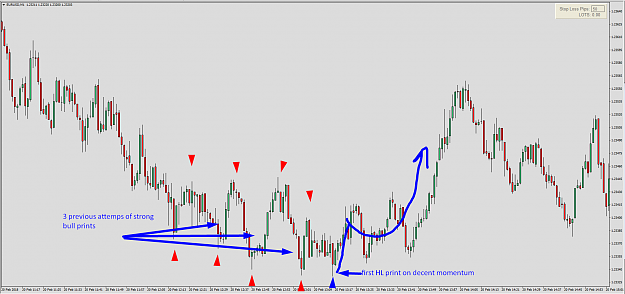
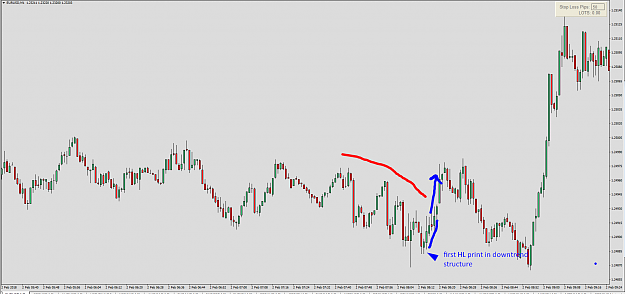
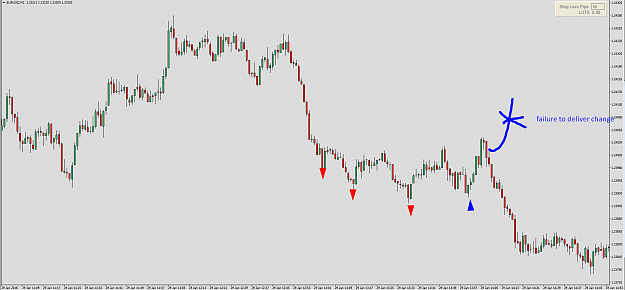
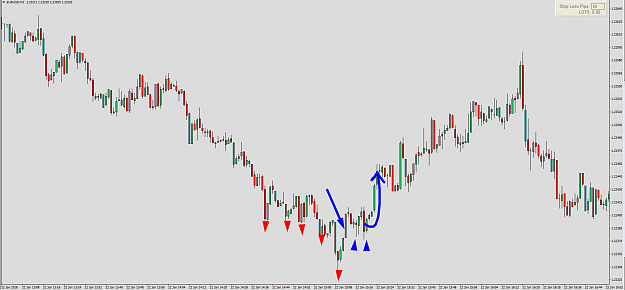
First higher low in symmetric down trend printed with momentum
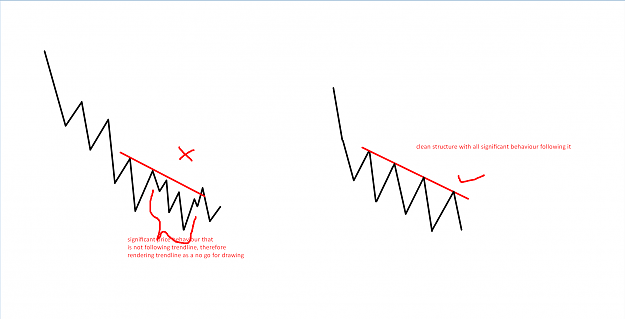
First HL in clean structured down trend , especially under condensed structure can often be a solid clue for potential short term trend change. Especially when printed with significant momentum. Important to keep eye on is that structure previously behaves with symmetrical volatility on lows and highs and there is clean behaviour change visible. (same goes for LH print for bearish information)
Key information is that structure needs repeatable behaviour previously in order for such HL print to be relevant. If down trend was droping heavily in single bear leg and suddenly price prints HL such info is not edge relative. It needs to be consistent marks of highs and lows in down trend with clean behaviour change. Price action interpretation is always situation relative to previous behaviour its not a math where 2 and 2 equals 4, its all about relative to what.
Attached Image(s) (click to enlarge)
1