• Home
  • Forums
  • News
  • Calendar
  • Market
  • Login
  • Join
  • User/Email: Password:
  • 2:09pm
Menu
  • Forums
  • News
  • Calendar
  • Market
  • Login
  • Join
  • 2:09pm
Sister Sites
  • Energy EXCH
  • Crypto Craft
  • Forex Factory

Options

Bookmark Thread

First Page First Unread Last Page Last Post

Print Thread

Similar Threads

Market maker ideas gold/eur/gbp pairs 0 replies

Spot gold EA from OG gold system 8 replies

Gold Miner - Gold future support and resistance level trade 7 replies

  • Interactive Trading
  • /
  • Reply to Thread
  • Subscribe
  • 100
Attachments: The Skenobi Speculations - The Gold Market
Exit Attachments
Tags: The Skenobi Speculations - The Gold Market
Cancel

The Skenobi Speculations - The Gold Market

  • Last Post
  •  
  • Page 1 2 3
  • Page 1 2 3
  •  
  • Post #1
  • Quote
  • First Post: Edited Jun 12, 2019 1:44am Jun 2, 2019 11:40am | Edited Jun 12, 2019 1:44am
  •  skenobi
  • Joined Oct 2007 | Status: Former institutional dogsbody | 1,253 Posts
This thread is where I'll be posting my views and other commentary on the metals markets.

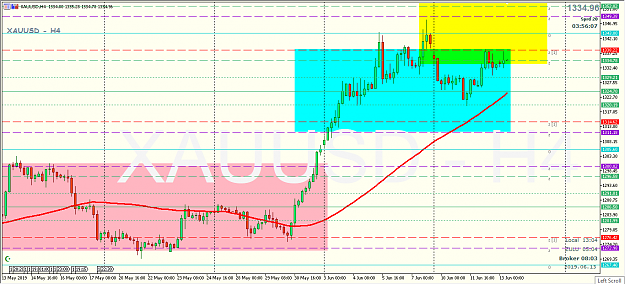
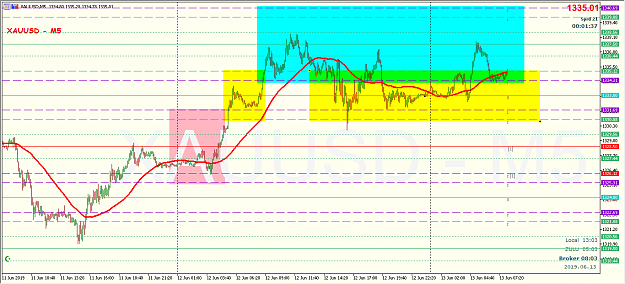
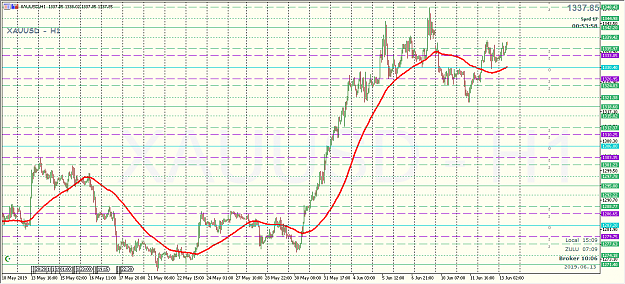
The S/R levels (i.e. likely bank trader order levels) as depicted in their respective timeframes in my following posts have not changed, and will likely NEVER change regardless what happens in financial markets.

What follows is my own world view, developed from an institutional trading career dating back to 1995.

I won't comment much on fundamentals except by way of snarky comments which may or may not jive with the pseudo intellectuals who alway need to be "right".

To be clear: I'M NOT INTERESTED IN CONVINCING ANYONE. If you, the reader, need convincing, go find a market goo-roo someplace else.

Enjoy!
I'm not trying to convince anyone. I'm not in the "convincing" business.
  • Post #2
  • Quote
  • Jun 2, 2019 3:55pm Jun 2, 2019 3:55pm
  •  priceaction1
  • Joined Apr 2013 | Status: Now I know you | 5,809 Posts
what comes next, let see!
don't predict direction, but dance with flow of water
 
 
  • Post #3
  • Quote
  • Edited Jun 6, 2019 6:35am Jun 5, 2019 11:54pm | Edited Jun 6, 2019 6:35am
  •  GoldGrilz
  • | Joined Jun 2010 | Status: Member | 201 Posts
I'm witit! preach obi-one-skenobi
 
 
  • Post #4
  • Quote
  • Jun 12, 2019 4:32am Jun 12, 2019 4:32am
  •  skenobi
  • Joined Oct 2007 | Status: Former institutional dogsbody | 1,253 Posts
I'm gonna start with the most basic pair, XAUUSD.

For everyone's guide, I use the slope of a simple 60-bar moving average to determine my direction.

Some of you will take exception to the simplicity.

I don't really care to be honest. I've used many new-fangled indicators since 1995, and I've always fallen back to SMA60.
I'm not trying to convince anyone. I'm not in the "convincing" business.
 
2
  • Post #5
  • Quote
  • Jun 12, 2019 4:43am Jun 12, 2019 4:43am
  •  skenobi
  • Joined Oct 2007 | Status: Former institutional dogsbody | 1,253 Posts
To set the scene, I'm gonna assume (for now) that Gold will not move out of the upper and lower bounds of the W1 chart of XAUUSD.

In other words, price will not set up a new trend above 1350 or below 1275 for the foreseeable future.

Attached Image (click to enlarge)
Click to Enlarge

Name: 190612_164047 - XAU w1.png
Size: 30 KB


On the D1 chart, the ceiling at 1350 ceiling looks pretty strong. Based on my polling of former bank trader counterparts, orders above this 1350 level should cap any moves higher, unless risk aversion comes back in force.

Attached Image (click to enlarge)
Click to Enlarge

Name: 190612_162538 - XAU D1.png
Size: 28 KB


On the H4 chart, the trend is clearly up if we're going by the slope of the SMA60, but we're already seeing daytrader offers much earlier around 1335.

Attached Image (click to enlarge)
Click to Enlarge

Name: 190612_162603 - XAU H4.png
Size: 28 KB


On the M5 chart, you can already see scalpers hitting resistance. You should be able to find plenty of scalping opportunities here.

Attached Image (click to enlarge)
Click to Enlarge

Name: 190612_164219 - XAU M5.png
Size: 35 KB
I'm not trying to convince anyone. I'm not in the "convincing" business.
 
3
  • Post #6
  • Quote
  • Jun 12, 2019 4:49am Jun 12, 2019 4:49am
  •  skenobi
  • Joined Oct 2007 | Status: Former institutional dogsbody | 1,253 Posts
At this point I'm going to expound on my methodology for trading news and economic events:

  1. I respect traders who can make money from trading fundamentals.
  2. I don't trade fundamentals.
  3. I don't care about fundamentals... at least not the way rabid fundamental fanboys care about it.
  4. I only care about what happens before and after fundamental events.
  5. I don't care if the fundamental events jive (or don't jive) with price direction.
  6. I only care about what price is doing at the moment.

I'm not trying to convince anyone. I'm not in the "convincing" business.
 
6
  • Post #7
  • Quote
  • Jun 13, 2019 12:54am Jun 13, 2019 12:54am
  •  Goat
  • Joined Jan 2009 | Status: FREE ROSS | 1,585 Posts
Quoting skenobi
Disliked
rabid fundamental fanboys
Ignored
Wait, what'd you just call me?!?

I like your analysis so I'll just try to watch quietly.
 
1
  • Post #8
  • Quote
  • Jun 13, 2019 1:06am Jun 13, 2019 1:06am
  •  skenobi
  • Joined Oct 2007 | Status: Former institutional dogsbody | 1,253 Posts
Quoting Goat
Disliked
{quote} Wait, what'd you just call me?!? I like your analysis so I'll just try to watch quietly.
Ignored

I'm not trying to convince anyone. I'm not in the "convincing" business.
 
 
  • Post #9
  • Quote
  • Jun 13, 2019 1:18am Jun 13, 2019 1:18am
  •  skenobi
  • Joined Oct 2007 | Status: Former institutional dogsbody | 1,253 Posts
Nothing's changed on the H4. Medium term bulls are being capped by offers clustering between 1335-1340 (that I know of).

Attached Image (click to enlarge)
Click to Enlarge

Name: 190613_130422 - XAU H4.png
Size: 28 KB


Just by looking at how price action is NOT respecting the new bullish set (i.e. not making any progress breaking upwards from the blue-colored zone in the M5 chart), leads me to believe XAUUSD will range-trade with plenty of scalping opportunities.

Attached Image (click to enlarge)
Click to Enlarge

Name: 190613_130336 - XAU M5.png
Size: 30 KB


To be clear: I'll only call a new uptrend if spot breaks higher than the blue zone, and I'll call a new downtrend if spot breaks below the yellow box.

As always, do use the S/R levels in the charts for target setting; these levels will never change for a long time.

Why? Because markets have memory... which is another way of saying herds are stupid that way.
I'm not trying to convince anyone. I'm not in the "convincing" business.
 
3
  • Post #10
  • Quote
  • Jun 13, 2019 1:24am Jun 13, 2019 1:24am
  •  Goat
  • Joined Jan 2009 | Status: FREE ROSS | 1,585 Posts
Quoting skenobi
Disliked
offers clustering between 1335-1340 (that I know of)
Ignored
If you don't mind me asking what are you looking at to see those orders Skenobi?!
 
1
  • Post #11
  • Quote
  • Jun 13, 2019 1:39am Jun 13, 2019 1:39am
  •  GoldGrilz
  • | Joined Jun 2010 | Status: Member | 201 Posts
TY obi-won-skenobi! You've been with them institutional big-boyz.... I'm all ears!

D1,H4&5M are the only tfs you look at?
 
 
  • Post #12
  • Quote
  • Jun 13, 2019 2:33am Jun 13, 2019 2:33am
  •  swagtrading
  • Joined May 2019 | Status: Member | 983 Posts
Great thread Skenboi. Interesting that you are looking at the slope of the MA rather than MA itself. Looking forward to your trading.
 
 
  • Post #13
  • Quote
  • Jun 13, 2019 2:53am Jun 13, 2019 2:53am
  •  skenobi
  • Joined Oct 2007 | Status: Former institutional dogsbody | 1,253 Posts
Quoting Goat
Disliked
{quote} If you don't mind me asking what are you looking at to see those orders Skenobi?!
Ignored
Those horizontal S/Rs you see are static fibonacci lines.

It means I pick one line as the base and then I project fibonaccis upwards and downwards from that baseline.

Because I only pick the baseline once (the same for each timeframe), the fibonaccis never change.

And I pick the original baseline that gives me the fibonaccis that closely match where I've (always) been seeing a lot of price action history in each timeframe.

(I picked 1000 as the baseline, by the way, and I will never change this)

Hardly scientific, but I find the generated fibos closely correspond to order levels I hear about in the markets.

I don't HAVE to use the fibos, tho..

I can just draw the horizontal lines manually from using the peaks and valleys on a line chart as my guide.

Takes practice.

NOTE THAT THIS THREAD is NOT about the fibos or any indicator or whether 1000 is the correct baseline or whether fibonacci trading is just mumbo-jumbo...

It's about how I trade price action behaviour around horizontal S/Rs, which anyone can learn from any S/R goo-roo out there.

(and yes, I like to spell GURU as GOO-ROO. Sue me. )
I'm not trying to convince anyone. I'm not in the "convincing" business.
 
3
  • Post #14
  • Quote
  • Jun 13, 2019 2:56am Jun 13, 2019 2:56am
  •  skenobi
  • Joined Oct 2007 | Status: Former institutional dogsbody | 1,253 Posts
Quoting GoldGrilz
Disliked
TY obi-won-skenobi! You've been with them institutional big-boyz.... I'm all ears! D1,H4&5M are the only tfs you look at?
Ignored

I show W1 and D1 for context, but I look at H4, H1,and M5 mostly.

I show M5 even though I don't scalp XAU, but maybe gold scalpers might find the S/R levels useful for stop setting.
I'm not trying to convince anyone. I'm not in the "convincing" business.
 
 
  • Post #15
  • Quote
  • Jun 13, 2019 3:01am Jun 13, 2019 3:01am
  •  skenobi
  • Joined Oct 2007 | Status: Former institutional dogsbody | 1,253 Posts
Quoting Goat
Disliked
{quote} If you don't mind me asking what are you looking at to see those orders Skenobi?!
Ignored
Maybe I misunderstood your question earlier.

My lines, I generate myself, which as I said, will never change.

I get the order levels from former institutional counterparts in the space, and the levels they tell me more or less confirm my own lines.

Sometimes I get them, sometimes I don't coz they're not always free to talk to an old retired geezer like me.
I'm not trying to convince anyone. I'm not in the "convincing" business.
 
 
  • Post #16
  • Quote
  • Jun 13, 2019 3:11am Jun 13, 2019 3:11am
  •  skenobi
  • Joined Oct 2007 | Status: Former institutional dogsbody | 1,253 Posts
Quoting skenobi
Disliked
{quote} Those horizontal S/Rs you see are static fibonacci lines.
Ignored
If y'all aren't familiar with "static fibos", maybe you've heard of fibonacci grids?

Anyways, like I said, my way of generating the static fibo S/Rs may not be all that scientific.

But as long as price action continues to "respect" the lines, I don't really care *smirk*

Don't take my word for it. Use your eyes:

Attached Image (click to enlarge)
Click to Enlarge

Name: 190613_151002 - XAU H1.png
Size: 34 KB
I'm not trying to convince anyone. I'm not in the "convincing" business.
 
 
  • Post #17
  • Quote
  • Jun 13, 2019 3:14am Jun 13, 2019 3:14am
  •  skenobi
  • Joined Oct 2007 | Status: Former institutional dogsbody | 1,253 Posts
Quoting swagtrading
Disliked
Great thread Skenboi. Interesting that you are looking at the slope of the MA rather than MA itself. Looking forward to your trading.
Ignored
Yup... I'm not into that whole "MA crossover" thing.

Also note that just looking at the slope ain't all that scientific either. I just want an arbitrary way of calling out trends as I see it.

And not how other traders see it.
I'm not trying to convince anyone. I'm not in the "convincing" business.
 
 
  • Post #18
  • Quote
  • Jun 13, 2019 7:27am Jun 13, 2019 7:27am
  •  swagtrading
  • Joined May 2019 | Status: Member | 983 Posts
Quoting skenobi
Disliked
{quote} Yup... I'm not into that whole "MA crossover" thing. Also note that just looking at the slope ain't all that scientific either. I just want an arbitrary way of calling out trends as I see it. And not how other traders see it.
Ignored
Thanks Skenobi for your explainer!
 
 
  • Post #19
  • Quote
  • Jun 13, 2019 12:15pm Jun 13, 2019 12:15pm
  •  skenobi
  • Joined Oct 2007 | Status: Former institutional dogsbody | 1,253 Posts
My next comment will be in the weekend or Monday. Goin' out of town for a couple of days.

Y'all have a swell weekend!
I'm not trying to convince anyone. I'm not in the "convincing" business.
 
 
  • Post #20
  • Quote
  • Jun 13, 2019 12:25pm Jun 13, 2019 12:25pm
  •  Metallurgy
  • Joined Jun 2019 | Status: Member | 259 Posts
Replying to get this on my subscriptions list, looks interesting so far. Even if the thread title gives me conspiracy theory vibes

Have a good weekend!
GOLD All Time Return: 113.2%
 
 
  • Interactive Trading
  • /
  • The Skenobi Speculations - The Gold Market
  • Reply to Thread
    • Page 1 2 3
    • Page 1 2 3
0 traders viewing now
  • More
Top of Page
  • Facebook
  • Twitter
About MM
  • Mission
  • Products
  • User Guide
  • Blog
  • Contact
MM Products
  • Forums
  • Calendar
  • News
  • Market
MM Website
  • Homepage
  • Search
  • Members
  • Report a Bug
Follow MM
  • Facebook
  • Twitter

MM Sister Sites:

  • Energy EXCH
  • Crypto Craft
  • Forex Factory

Metals Mine™ is a brand of Fair Economy, Inc.

Terms of Service / ©2023