My new bar is price bar, and it based on range bar, but my new bar is different from traditional one on construction. I found that traditional range bar has a fatal mistake, and I modified it and make it real price bar. Please see the screenshot 1,below is rangebar chart ,pls not mistake it for timebar chart
Suppose each range bar set 20 pips.
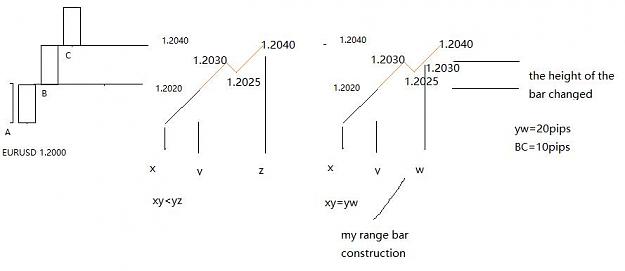
At first, price from point A to point B directly, there is no retracement, here there are no problem.the height of AB= the width of xy = 20pips
then price point B to point C, however, in this procedure, price has retracement, price from 1.2020, then 1.2030, then 1.2025, at last 1.2040. in traditional range bar, it only consider start and destination, so even price has retracement within the bar, the width of yz still has the same width. however, the truth is the width became large. the real width of yz= (1.2030-1.2020)+(1.2030-1.2025)+(1.2040-1.2025)=10+5+15=30pips > traditional 20 pips
It is unfortune that our platform does not support width-change bar, but we have the other method that keep the width of bar and the heith of the bar changed.
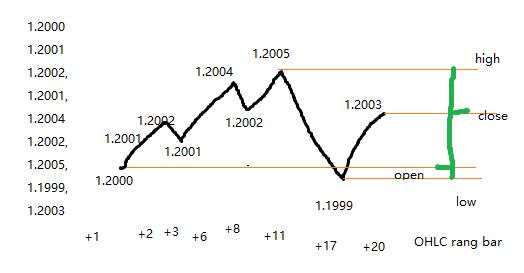
in tradtional range bar chart, we only know pips in vertical direction , not knowing what horizontal direction mean. I would tell you that the width of range bar is just pips counter. when the price up and down ADD UP to the number of what you set, a new bar formed, different from traditional bar only considering start and destination. If so, you will see OHLC in range bar. Price bar is most powerful ,but traditional range bar use interpolation arithmetic method----- it is artificial bar not real bar. the real bar require data feed , restoring data like tick bar for MT4. the difference is tick bar is just change of price , and my new bar is QUANTITY of price-----that when price up and down add up to what you set. This kind of bar take example by both rangebar and tickbar.
My new bar consider the procedure. if you set 20 pips a bar, the start price is 1.2000, and then 1.2001,1.2002,1.2001,1.2004,1.2002,1.2005,1.1999,1.2003,for traditional range bar, a new bar will never formed because of its only considering start and destination price, but my new bar it formed a new bar, calculation as (1.2001-1.2000)+(1.2002-1.2001)+(1.2004-1.2001)+(1.2004-1.2002)+(1.2005-1.2002)+(1.2005-1.1999)+(1.2003-1.1999)=20pips, a new bar formed.
Suppose each range bar set 20 pips.
At first, price from point A to point B directly, there is no retracement, here there are no problem.the height of AB= the width of xy = 20pips
then price point B to point C, however, in this procedure, price has retracement, price from 1.2020, then 1.2030, then 1.2025, at last 1.2040. in traditional range bar, it only consider start and destination, so even price has retracement within the bar, the width of yz still has the same width. however, the truth is the width became large. the real width of yz= (1.2030-1.2020)+(1.2030-1.2025)+(1.2040-1.2025)=10+5+15=30pips > traditional 20 pips
It is unfortune that our platform does not support width-change bar, but we have the other method that keep the width of bar and the heith of the bar changed.
in tradtional range bar chart, we only know pips in vertical direction , not knowing what horizontal direction mean. I would tell you that the width of range bar is just pips counter. when the price up and down ADD UP to the number of what you set, a new bar formed, different from traditional bar only considering start and destination. If so, you will see OHLC in range bar. Price bar is most powerful ,but traditional range bar use interpolation arithmetic method----- it is artificial bar not real bar. the real bar require data feed , restoring data like tick bar for MT4. the difference is tick bar is just change of price , and my new bar is QUANTITY of price-----that when price up and down add up to what you set. This kind of bar take example by both rangebar and tickbar.
My new bar consider the procedure. if you set 20 pips a bar, the start price is 1.2000, and then 1.2001,1.2002,1.2001,1.2004,1.2002,1.2005,1.1999,1.2003,for traditional range bar, a new bar will never formed because of its only considering start and destination price, but my new bar it formed a new bar, calculation as (1.2001-1.2000)+(1.2002-1.2001)+(1.2004-1.2001)+(1.2004-1.2002)+(1.2005-1.2002)+(1.2005-1.1999)+(1.2003-1.1999)=20pips, a new bar formed.
Attached Image (click to enlarge)
Attached Image