QUAD CANDLE SYSTEM
D1 Time Frame
My view on trading is to take what works and bin what doesn't.
Everything else is either a theoretical or research oriented exercise.
Learning is ongoing and continual.
Transparent Traders are the Only true traders !
Do not be fooled by those who hide behind smoke and mirrors !
MASTERRMIND
================================================================================================="Being in the brokerage business myself and handling large accounts, I had opportunities seldom afforded the ordinary man for studying the cause of success or failure in the speculations of others. I found that over ninety per cent of the traders that go into the market without knowledge or study usually lose in the end"
W D Gann
=================================================================================================Alleged Trading Performance by WD Gann
1908 – $130 account increased to $12000 in 30 days.
1923 – $973 account increased to $30000 in 60 days.
1933 – 479 trades were made with 422 being profitable. Strike rate of 88% and a 4000% gain.
1946 – 3 month net profit of $13000 from starting capital of $4500 – a 400% profit.
W D Gann
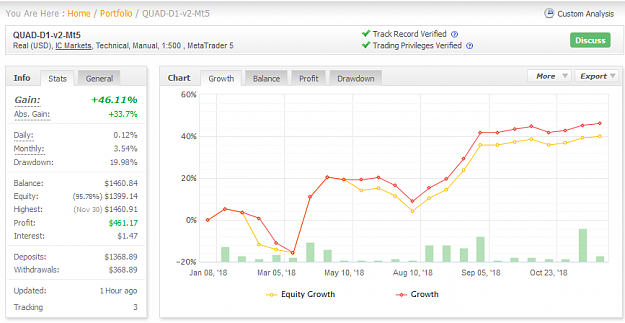
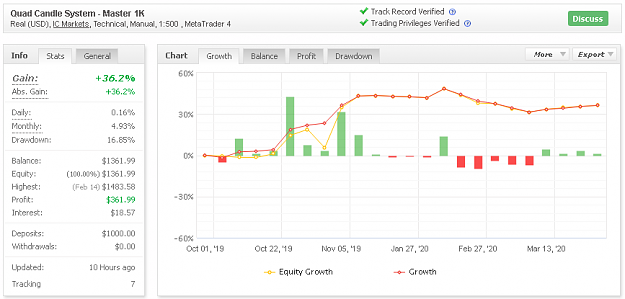
=================================================================================================LIVE TRADING PROGRESS
... coming in early 2023 ...
If thread participation continues then the account history will remain public but if participation dries up then the account may be removed from public viewing.
The Home of Longer Term Consistent Trading
=================================================================================================QUAD CANDLE SYSTEM METHODOLOGY
The QUAD CANDLE SYSTEM (QCS) is designed for trading the higher time frames only !
Daily Time Frame [D1] is the preferred period to trade.
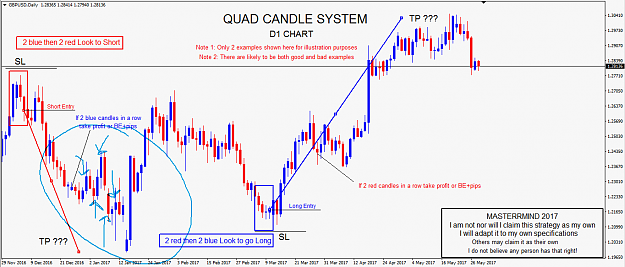
The QCS system is based around 4 by D1 candle formations with respect to the following:
a) 2 bullish candles followed by 2 bearish candles looking to go short the market
or
b) 2 bearish candles followed by 2 bullish candles looking to go long the market
ENTRY (Basic criteria)
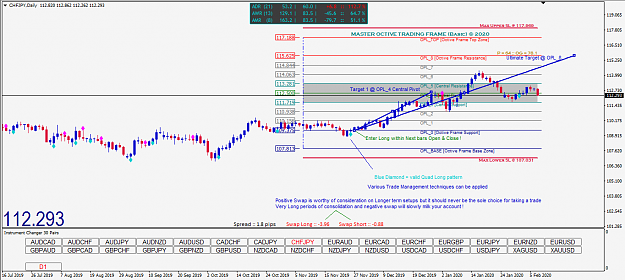
The Basic Version of a QCS entry uses the Quad Candle Patterns and the Master Octive Trading Frame (indicator).
Short Entry
Enter Short after Quad Candle Short Pattern (QCSP) has completed (preference is when price is in the Upper Octive Extreme Zone).
or
Long Entry
Enter Long after the Quad Candle Long Pattern (QCLP) has completed (preference is when price is in the Lower Octive Extreme Zone).
Entry occurs after Quad Candle Pattern completes meaning after D1 candle close and up until 5 minutes prior to the Entry Candles Close.
Consider any impact of spread at time of entry as applicable such as end of NY Session through into the Asian Session when spread(s) might be 'high'.
Valid Entry
A valid entry must occur within the QCS Entry Candle time.
The QCS Entry Candle is the next candle in the sequence after a valid Quad Pattern is confirmed.
D1 TF = Entry within Open and Close of the QCS Entry Candle (D1);
W1 TF = Entry within Open and Close of the QCS Entry Candle (W1).
Similarly for other time frames being traded.
Since entry can be made within the relevant QCS Entry Candle, market orders as well as pending orders can be applied; pending orders might offer an opportunity to enter at a 'better' price after a pullback occurs.
An entry may occur at any time within the current QCS Entry Candle.
An advantage of this is in the situation where a pullback occurs allowing a trader to get into the market at a 'better' price resulting in potentially a 'better' reward risk ratio (RR).
The Fib Tool can be applied across the range of the most recent candle of the valid Quad Candle Pattern with an entry set at 38.2 or 50.0 or 61.8.
A disadvantage is if price does not pullback and instead continues in the setup direction leaving you on the sidelines resulting in a missed opportunity or having to enter at a less than favorable price.
It is not advisable to enter too late into a trade based on an assessment of Pips Moved versus ADR (if D1 traded).
Trader discretion may well be required at times based around their own trading plan and the particular symbol being considered.
A Quad Pattern is valid at any location on the chart (provided broker datafeed is current and no missing data is present) meaning it does not have to be in an Extreme Zone (potentially longer pip tallies occur from entries made near the extreme zones provided stopout does not occur).
Chart Structure and Confluence should be applied in all QCS Setups to provide an entry with the highest probabilistic outcome.
If it is not then a reduced applied risk should be used such as trading same SL pips but at half the volume meaning 1/2 'normal' risk.
ADDITIONAL ENTRIES
Quads -
1st entry (Entry 1) in a setup should follow the Quad pattern entry criteria as posted above;
2nd and subsequent entries (Additional Entry A, B, C, D etc) of the same Quad Setup can follow same bias Quad Pattern but they do not need too.
The addition of trades (2 or more) are at the discretion of the trader and can be based on the following:
a) Master Octive Trading Frame price levels:
Additional Entry A @ Entry 1 price +/- 2 OGs,
Additional Entry B @ Entry 1 price +/- 3 OGs,
Additional Entry C @ Entry 1 price +/- 4 OGs, and
Additional Entry D @ Entry 1 price +/- 5 OGs
Note 1: Allow a minimum 2 Octive Gaps before adding in the first additional trade, this is to give brathing space to Entry 1 and allow for some PnL.
Note 2: Additional Entry B,C,D etc can then be set as pending orders at 1 OG apart using Master Octive Trading Frame price levels if desired.
Note 2: Additional trades should not be applied any closer than 2 OGs from the main target zone;
b) Quad Patterns (next in series or in confluence with S&R levels);
c) Candlestick patterns
d) Support + Resistance and Chart Structure;
e) Fibonacci ratios;
f) Harmonics;
g) Range Ratios (eg. Pips moved Vs ADR/AWR/AMR etc);
h) Gann Levels; or
Note 1: The addition of all trades that form a Quad Setup must be designed such that the sum total of all the SLs is less than the total assigned risk.
Note 2: The assigned risk per trade is typically in the range 0.5% - 5%.
Note 3: The total assigned risk across the account is typically 1.5% - 15% for a cycle of 3 to 5 trades.
Note 4: It is highly recommended that minimal risk be applied on initial entries and as trading progresses favorably then increase trading volume.
The 1st entry is arguably the most important of the sequence of trades in a Quad Setup since it is in a location that the trader expects to be the start of a new super trend either UP or DOWN as the case may be and the addition of trades is expected to add considerably to the growth of the account.
The careful addition of trades to a given Quad Setup is what provides the potential acceleration in growth.
At all times the risk should be monitored and controlled as much as possible from the traders end.
Some risk such as broker negative slippage, flash crashes and black swan events may not be possible to control by the trader.
TRADING VOLUME
Trading volume should be reduced slightly on a fresh account (this can avoid more serious drawdowns early on when growth is non-existent).
During a cycle of trades once an entry has been locked in at BE+pips this frees up volume which may then allow for additional trades based on current volume limits.
Dream Levels (DL) through the Power of Compounding
Compounding Monthly Projections(No Additional Deposits) to create the Dream Level (DL):
US$1000 to US$1Million
DL1. Compounding a 1K account at ~5.93% MoM ==> 1K to 1 Million in ~10 years.
DL2. Compounding a 1K account at ~7.47% MoM ==> 1K to 1 Million in ~8 years.
DL3. Compounding a 1K account at ~10.08% MoM ==> 1K to 1 Million in ~6 years.
DL4. Compounding a 1K account at ~15.49% MoM ==> 1K to 1 Million in ~4 years.
DL5. Compounding a 1K account at ~33.36% MoM ==> 1K to 1 Million in ~2 years.
US$10,000 to US$1Million
DL1. Compounding a 10K account at ~3.92% MoM ==> 10K to 1 Million in ~10 years.
DL2. Compounding a 10K account at ~4.93% MoM ==> 10K to 1 Million in ~8 years.
DL3. Compounding a 10K account at ~6.62% MoM ==> 10K to 1 Million in ~6 years.
DL4. Compounding a 10K account at ~10.1% MoM ==> 10K to 1 Million in ~4 years.
DL5. Compounding a 10K account at ~21.2% MoM ==> 10K to 1 Million in ~2 years.
Compounding Monthly Projections using 1K topups until total invested capital is hit to create the Dream Level (DL):
DL1. Compounding a 1K account (with regular deposits of 1000, Tot Inv Cap. = $120K) at 2.84% MoM ==> 1K to 1 Million in ~10 years.
DL2. Compounding a 1K account (with regular deposits of 1000, Tot Inv Cap. = $116K) at 3.00% MoM ==> 1K to 1 Million in ~9 years 8 months.
DL3. Compounding a 1K account (with regular deposits of 1000, Tot Inv Cap. = $94K) at 4.00% MoM ==> 1K to 1 Million in ~7 years 10 months.
DL4. Compounding a 1K account (with regular deposits of 1000, Tot Inv Cap. = $80K) at 5.00% MoM ==> 1K to 1 Million in ~6 years 8 months.
DL5. Compounding a 1K account (with regular deposits of 1000, Tot Inv Cap. = $48K) at 10.00% MoM ==> 1K to 1 Million in ~4 years.
Note 1: Tot Inv Cap. means Total Invested Capital made up of Start Balance plus the sum of all regular deposits until 1M (Equity) is achieved.
Note 2: Based on continual deposits over the course of the preferred DL period it will not be possible to state later that 1K went on to make 1M.
Note 3: It is the traders choice whether a regular deposit strategy is applied to the trading account or not.
For example,
DL1 suggests that about $120K would be applied to make $1M;
DL2 suggests that about $116K would be applied to make $1M;
DL3 suggests that about $94K would be applied to make $1M;
DL4 suggests that about $80K would be applied to make $1M; and
DL5 suggests that about $48K would be applied to make $1M.
Any of these outcomes entails successful trading over the longer term such that milestones and goals are achieved.
Example Risk Values for a semi-aggressively traded longer term account:
Assigned Risk Per Trade ARPT (Max.): 5%
Assigned Risk Per Account ARPA (Max.): 15%
Drawdown (Max DD): 30%
Peak To Trough (Equity Max.): 30%
Dream Level Variation (applies when DL is active):
- if after a 3 month (calendar) trading period the DL rate has not been met at least once then the next lower DL rate will be applied;
- the ARPA must be reduced immediately by a factor of 2 commencing from the start of the next calendar month;
- if the original DL rate is again met on any future month then the ARPA may be increased up to the applicable maximum.
Breaching Drawdown and Peak To Trough limits (applies to all):
- if the DD limit is breached then the Risk Per Account must be reduced by a factor of 2 over the following calendar month (penalty month);
- if the limits are not exceeded during the penalty month then Risk Per Trade may be increased up to the maximum of the applicable DL;
- should the penalty month limits also be breached then Risk Per Trade must again be reduced by a factor of 2.
Max Lot Size (per trade) and Recommended Volume Ranges (applies to all):
- Max Lot Size = Equity/10000
- Recommended Volume Range = [Equity/100000 to Equity/20000]
If Equity >= $1000 && <$2000 then Max Lot Size = 0.10 lots --> recommended [0.01 to 0.05]
1K Equity (Max Lot Size = 0.10)
Trade 1 @ 0.01
Trade 2 @ 0.02
Trade 3 @ 0.03
Trade 4 @ 0.04
Trade 5 @ 0.05
Tot. Volume = (0.01 + 0.02 + 0.03 + 0.04 + 0.05) = 0.15 (1.5* Max Lot Size).
If Equity >= $2000 && <$3000 then Max Lot Size = 0.20 lots --> recommended [0.02 to 0.10]
2K Equity (Max Lot Size = 0.20)
Trade 1 @ 0.02
Trade 2 @ 0.04
Trade 3 @ 0.06
Trade 4 @ 0.08
Trade 5 @ 0.10
Tot. Volume = (0.02 + 0.04 + 0.06 + 0.08 + 0.10) = 0.30 (1.5* Max Lot Size).
If Equity >= $3000 && <4000 then Max Lot Size = 0.30 lots --> recommended [0.03 to 0.15]
3K Equity (Max Lot Size = 0.30)
Trade 1 @ 0.03
Trade 2 @ 0.06
Trade 3 @ 0.09
Trade 4 @ 0.12
Trade 5 @ 0.15
Tot. Volume = (0.03 + 0.06 + 0.09 + 0.12 + 0.15) = 0.45 (1.5* Max Lot Size).
If Equity >= $4000 && <$5000 then Max Lot Size = 0.40 lots --> recommended [0.04 to 0.20]
4K Equity (Max Lot Size = 0.40)
Trade 1 @ 0.04
Trade 2 @ 0.08
Trade 3 @ 0.12
Trade 4 @ 0.16
Trade 5 @ 0.20
Tot. Volume = (0.04 + 0.08 + 0.12 + 0.16 + 0.20) = 0.60 (1.5* Max Lot Size).
If Equity >= $5000 && < $6000 then Max Lot Size = 0.50 lots --> recommended [0.05 to 0.25]
5K Equity (Max Lot Size = 0.50)
Trade 1 @ 0.05
Trade 2 @ 0.10
Trade 3 @ 0.15
Trade 4 @ 0.20
Trade 5 @ 0.25
Tot. Volume = (0.05 + 0.10 + 0.15 + 0.20 + 0.25) = 0.75 (1.5* Max Lot Size).
...
...
If Equity >= $10,000 && <$20,000 then Max Lot Size = 1.00 lots --> recommended [0.10 to 0.50]
10K Equity (Max Lot Size = 1.00)
Trade 1 @ 0.10
Trade 2 @ 0.20
Trade 3 @ 0.30
Trade 4 @ 0.40
Trade 5 @ 0.50
Tot. Volume = (0.10 + 0.20 + 0.30 + 0.40 + 0.50) = 1.50 (1.5* Max Lot Size).
If Equity >= $20,000 && <$30,000 then Max Lot Size = 2.00 lots --> recommended [0.20 to 1.00]
20K Equity (Max Lot Size = 2.00)
Trade 1 @ 0.20
Trade 2 @ 0.40
Trade 3 @ 0.60
Trade 4 @ 0.80
Trade 5 @ 1.00
Tot. Volume = (0.20 + 0.40 + 0.60 + 0.80 + 1.00) = 3.00 (1.5* Max Lot Size).
If Equity >= $30,000 && <$40,000 then Max Lot Size = 3.00 lots --> recommended [0.30 to 1.50]
30K Equity (Max Lot Size = 3.00)
Trade 1 @ 0.30
Trade 2 @ 0.60
Trade 3 @ 0.90
Trade 4 @ 1.20
Trade 5 @ 1.50
Tot. Volume = (0.30 + 0.60 + 0.90 + 1.20 + 1.50) = 4.50 (1.5* Max Lot Size).
If Equity >= $40,000 && < $50,000 then Max Lot Size = 4.00 lots --> recommended [0.40 to 2.00]
40K Equity (Max Lot Size = 4.00)
Trade 1 @ 0.40
Trade 2 @ 0.80
Trade 3 @ 1.20
Trade 4 @ 1.60
Trade 5 @ 2.00
Tot. Volume = (0.40 + 0.80 + 1.20 + 1.60 + 2.00) = 6.00 (1.5* Max Lot Size).
If Equity >= $50,000 && <$60,000 then Max Lot Size = 5.00 lots --> recommended [0.50 to 2.50]
50K Equity (Max Lot Size = 5.00)
Trade 1 @ 0.50
Trade 2 @ 1.00
Trade 3 @ 1.50
Trade 4 @ 2.00
Trade 5 @ 2.50
Tot. Volume = (0.50 + 1.00 + 1.50 + 2.00 + 2.50) = 7.50 (1.5* Max Lot Size).
...
...
If Equity >= $100,000 && <$200,000 then Max Lot Size = 10.00 lots --> recommended [1.00 to 5.00]
100K Equity (Max Lot Size = 10.00)
Trade 1 @ 1.00
Trade 2 @ 2.00
Trade 3 @ 3.00
Trade 4 @ 4.00
Trade 5 @ 5.00
Tot. Volume = (1.00 + 2.00 + 3.00 + 4.00 + 5.00) = 15.0 (1.5* Max Lot Size).
If Equity >= $200,000 && <$300,000 then Max Lot Size = 20.00 lots --> recommended [2.00 to 10.00]
200K Equity (Max Lot Size = 20.00)
Trade 1 @ 2.00
Trade 2 @ 4.00
Trade 3 @ 6.00
Trade 4 @ 8.00
Trade 5 @ 10.00
Tot. Volume = (2.00 + 4.00 + 6.00 + 8.00 + 10.00) = 30.00 (1.5* Max Lot Size).
If Equity >= $300,000 && < $400,000 then Max Lot Size = 30.00 lots --> recommended [3.00 to 15.00]
300K Equity (Max Lot Size = 30.00)
Trade 1 @ 3.00
Trade 2 @ 6.00
Trade 3 @ 9.00
Trade 4 @ 12.00
Trade 5 @ 15.00
Tot. Volume = (3.00 + 6.00 + 9.00 + 12.00 + 15.00) = 45.0 (1.5* Max Lot Size).
If Equity >= $400,000 && <$500,000 then Max Lot Size = 40.00 lots --> recommended [4.00 to 20.00]
400K Equity (Max Lot Size = 40.00)
Trade 1 @ 4.00
Trade 2 @ 8.00
Trade 3 @ 12.00
Trade 4 @ 16.00
Trade 5 @ 20.00
Tot. Volume = (4.00 + 8.00 + 12.00 + 16.00 + 20.00) = 60.00 (1.5* Max Lot Size).
If Equity >= $500,000 && < $600,000 then Max Lot Size = 50.00 lots --> recommended [5.00 to 25.00]
500K Equity (Max Lot Size = 50.00)
Trade 1 @ 5.00
Trade 2 @ 10.00
Trade 3 @ 15.00
Trade 4 @ 20.00
Trade 5 @ 25.00
Tot. Volume = (5.00 + 10.00 + 15.00 + 20.00 + 25.00) = 75.00 (1.5* Max Lot Size).
...
...
If Equity > $1,000,000 then Max Lot Size = 100.00 lots --> recommended [10.00 to 50.00]
1M Equity (Max Lot Size = 100.00)
Trade 1 @ 10.00
Trade 2 @ 20.00
Trade 3 @ 30.00
Trade 4 @ 40.00
Trade 5 @ 50.00
Tot. Volume = (10.00 + 20.00 + 30.00 + 40.00 + 50.00) = 150.00 (1.5* Max Lot Size).
When volume exceeds 100 lots you might need to seek approval from your broker to trade larger volumes ... typically a straight forward process.
If the broker fails to meet your increased volume per entry request then you have 2 options:
1. trade at broker max of 100 lots per entry and simply add an additional entry up to the applicable limit; or
2. Find another broker who will meet or preferably exceed your demands (simple enough).
Drawdown (Max) must remain within the set levels up to a maximum of 30%.
Account Risk Per Account for the most part will be as per DL designation up to a maximum of 15% when deemed appropriate.
The trading plan must be usable and exhibit a reasonable degree of flexibility without adversely harming risk control management.
Whilst traders are encouraged to modify the plan slightly to fit within their own preferred risk tolerance levels, I would discourage traders attempting to vastly modify these values and limits since I know from experience what limits are reasonable.
As experience grows and the account growth continues the more experienced traders can consider slightly higher risk levels although a smart trader would already know that the inbuilt flexibility of the system already allows for greater growth potential.
Imagine a USD$1000 account, it has the following trading volume settings:
If Equity >= $1000 && < $2000 then Max Lot Size = 0.10 lots --> recommended [0.01 to 0.05]
1K Equity (Max Lot Size (1 entry only) = 0.10 lots)
Trade 1 @ 0.01
Trade 2 @ 0.02
Trade 3 @ 0.03
Trade 4 @ 0.04
Trade 5 @ 0.05
Tot. Volume (max. 5 entries) = (0.01 + 0.02 + 0.03 + 0.04 + 0.05) = 0.15 lots (1.5* Max Lot Size).
In a situation where Trade 1, 2 and 3 were active and Trade 1 has been locked in at BE+pips then 0.01 lots could then be added back into the Total Trading Volume (0.15 lots + 0.01 lots) which is 0.16 lots.
If all Trades 2 and 3 are later locked in at BE+pips we would have:
New Trading Volume Limit = Total Trading Volume (current) + Trade 2 (0.02) + Trade 3 (0.03) = 0.16 lots + 0.02 lots + 0.03 lots = 0.21 lots.
Simply put it means as trades are moved to BE+pips the respective volume is added to the applicable Total Trading Volume value (Equity based).
A step further is to consider multiple cycles on an adequately funded trading account and you will soon realize that under favorable trading conditions as Equity increases within active cycles the trading volume can also increase and the gains can be major equity boosters.
BASIC TRADING TOOL ACCESS:
QCS Zip folder (MT4)
Ceased Updating (no longer available)
Expires: December 31, 2022.
Note:
1. The basic version shows only the Master Octive Grid and the basic QCS setup (stops and targets within the Master Octive Trading Frame);
2. It does not show the multi Gann Grids, Gann SQ9 Prices and Dates, Moon Phases, Yearly Reset date, modified calculations or any other advanced overlays.
3. Updates to the basic version indicator will be limited, it also contains an expiry date.
Master Octive Indicator (MT5)
MT5 (Basic version 1)
... pending final development and testing ...
=================================================================================================
ADVANCED TRADING TOOL ACCESS:
Please be advised that due to a number of reasons access to my advanced trading tools is only currently available to traders who are willing to provide the following information:
1. Trading Account Number;
2. Trading Account Type;
3. Contact Email address (for QCS_password generation);
4. Trader Participation in this thread is also required; and
5. Final access is at the sole discretion of the Thread Op.
Traders should decide if access to the trading tools suits with their current trading needs before providing such information.
Access if granted may be delayed during stages where code is being added, improved or major upgrades are in progress.
A series of overlays form part of the Advanced QCS Trading System and this may be expanded in the near future.
The Advanced Traders Toolkit comprises Expert Advisors, Indicators, Scripts, Templates and a QCS Operational Manual (PDF).
=================================================================================================
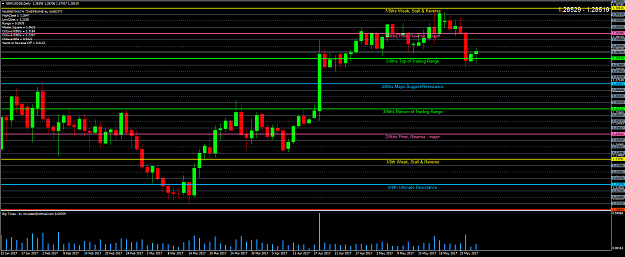
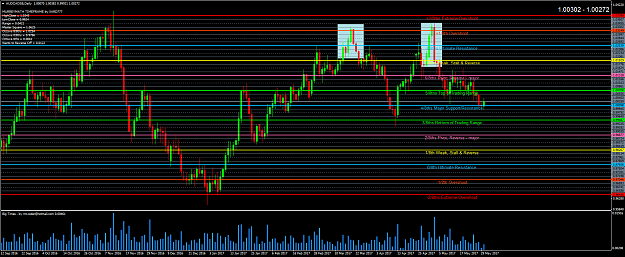
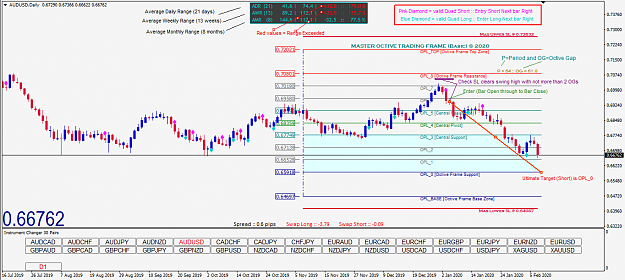
Master Octive Trading Frame (MOTF)
The Master Octive indicator will produce an Octive Trading Frame that draws a Grid of horizontal and vertical lines commencing from a Yearly Reset Date (YRD) in January.
The YRD is a date known well in advance since we know all of the future Moon phases for Full and New Moons and it is chosen as follows:
1. If the Full Moon date falls on or before January 15 of the following year then this date is used as the YRD.
2. If the Full Moon date falls after January 15 then the New Moon date is used as the YRD.
3. The Full Moon date will always be chosen if it occurs up to and including January 15 even if the New Moon occurred earlier in that month.
The YRD can be sourced from many locations but I will refer to the Time and Date website shown below:
https://www.timeanddate.com/moon/pha...york?year=2019
Referring to the screenshot of the Moon Phases for 2019 it is clear that:
1. Full Moon occurs on January 21 2019; and
2. New Moon occurs on January 5 2019
Since the Full Moon occurs after mid-month it is rejected and the New Moon date is used which in this case is January 5 2019.
The Octive Grid Reset Date (OGRD) will be Monday January 7, 2019 (the next trading day that falls on a Monday after the YRD).
Algorithm:
An elaborate algorithm is applied both internally and externally to the Master Octive indicator in MT4 and MT5 formats.
In short this simply means that there are 2 components that generate all of the levels for both the horizontal and vertical levels.
Due to not fully trusting the protection against de-compiling code in both ex4 and ex5 variants I have decided to split the algorithm into 2 sections.
One part of the algorithm is stored completely separately from all other indicators performing its calculations in semi isolation.
The 'advanced tools' version is very likely to be traded here in the thread using the MT5 EA (or Fix API, bridge setup).
Traders who apply the 'basic tools' as in a manual trading approach can still be very successful traders and look forward to consistent trading over the longer term provided Post 1 guidelines are adhered too since wavering from these QCS Guidelines will skew your own trading results over the longer term.
I may not share the 'advanced tools' though so please keep this in mind.
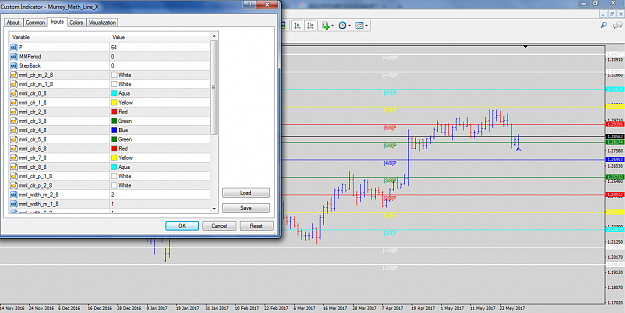
Quad Candle System [D1 TF]:
P=64 [Period in bars] is the default settings however the Advanced Toolkit has open possibilities.
Note: Default settings should be applied on a D1 TF unless otherwise stated.
Splitting the Symbols into different speeds (ADR's):
(a) Turtle (ADR < about 60 pips)
(b) Medium (ADR >60 and <100 pips)
(c) Fast (ADR >=100 pips)
A specific setting can be applied to a given symbol or alternatively an average 'best fit'.
The Octive Gaps shown on the Master Octive Trading Frame may change size when the parameters are altered (advanced version only).
In cases where the PA is seen to be 'out-of-sync' then we need to change the settings (advanced version only) slightly.
Stop Loss
Generally placed above or below the Quad Candle Cluster (QCC) depending on a short or long setup.
The Quad Candle Cluster is the grouping of candles (or bars) that form the Quad Candle Pattern and any adjacent (and close) candles.
Typically this is when a few nearby candles have ranges above a Quad Short Pattern or below a Quad Long Pattern and its desirable to have a stop that clears these levels.
Basically above or below the major swings as in the Quad Candle Cluster (Quad Pattern and any immediate bars forming structure).
However, the following may be used at the discretion of the trader:
1. Swing Highs or Lows or at QCC locations as mentioned above (allow a minimum gap of 20 pips above/below this level) including a 2 OG SL that clears this area and does not fall within the range;
2. ATR trace indicator (used for possibly trailing of stops);
3. Chart structural highs or lows as the case dictates;
4. Octive SL Logic
(a) If an Entry (Not Recommended) is to be made from either the Base Octive Price level (Base OPL) or Top Octive Price level (Top OPL)
i) minimum SL of at least 50% of the current Octive Gap should be applied
ii) maximum SL of 100% of the current Octive Gap
b) all other SLs from Octive levels should be a minimum of 1 Octive Gap up to a maximum of 2 Octive Gaps.
c) exceptions should be very very limited and relate to risk control parameters.
5. Extreme Entries
Quad Short Setup:
The Stop Loss must never exceed 1 Octive Gap (refer Master Octive Trading Frame) above the OPL_Top level for a Quad Short Setup.
The Stop Loss must also NOT exceed 2 Octive Gaps.
Quad Long Setup:
The Stop Loss must never exceed 1 Octive Gap (refer Master Octive Trading Frame) below the OPL_Base level for a Quad Long Setup.
The Stop Loss must also NOT exceed 2 Octive Gaps.
6. Initial SL settings should remain in place until price has moved a minimum 2 Octive Gaps in the favored direction then 1 OG can be locked in;
7. SL can be applied after 2 consecutive opposite candles have closed (QSS: close after 2 bullish candles; QLS: close after 2 bearish candles) under floating profit conditions else allow the trade to run on accepting stopout in a worse case scenario.
Take Profit
The targets are set after applying the stop loss settings in a minimum 1 RR (better 2:1, 3:1, 4:1 or higher) which are based on the Octive Gap.
Minimum Take Profit is 1 Octive Gap (1RR).
If 1 Octive Gap is the chosen SL then its possible to set up to a max 10RR target (Short OPL_Top down to OPL_0 or Long OPL_Base up to OPL_8).
If higher Octive Gap ratios are selected for the SL then the maximum RR levels will reduce since the SL pips have clearly increased and yet the MOTF remains unchanged in terms of available target pips (ie the MOTF when set has a fixed range).
We do not set targets into the Upper or Lower Extreme Zones since it is within these zones that we seek a reversal PA to unfold.
Maximum target level for a Quad Short Setup is the OPL_8 level.
Maximum target level for a Quad Long Setup is the OPL_0 level.
Minimum target level for either setup is 1 Octive Gap.
Trailing Stops
Trades may be trailed as the trader sees fit either manually or automated process.
I recommend on the initial entry to allow a minimum of 2 Octive Gaps before trailing at 1 Octive Gap.
This comes based on experience which shows that PA can whipsaw 1 Octive Gap taking you out so trail from greater than 1 Octive such as 2 OGs until the trade has progressed over several OG levels and is seen to being met with strong Support or Resistance (based on chart structure).
Alternatively a trader can use:
a) BE + some pips after price has moved favorably X_pips where X_pips > 1 OG;
b) ATR indicator (or %ADR, %AWR or %AMR);
c) Master Octive Trading Frame indicator;
d) Chart structure (eg longer term Support or Resistance zones or Candlestick Trailing);
e) 2 by D1 opposite colored candles (in series) form anytime after trade entry (floating profit showing); or
f) other methods (eg Fibonacci Trailing, Candlestick trailing, ATR trailing etc)
Note that the trailing method applied is determined by the trader.
It is logical to give lower relative volume entries larger breathing space as opposed to the higher relative volume entries later in the cycle.
Price will not always go in the direction you would like and indeed it may reverse after going a certain number of pips so it is sometimes necessary to simply close out the trade for some profit or a loss and search for the next opportunity.
Often the trader will need to balance between applying too tight of a stop and too generous of a stop.
I recommend considering the symbols ADR/AWR/AMR data in combination with the current Octive Gap when trailing.
Too tight of a stop and you might be kicked out of the trade too soon.
Too generous of a stop and you might give back too much floating profit.
Fundamental Analysis
Since this system applies D1 trade setups fundamental analysis is also important in terms of setting your own bias separate from that of the technical bias.
Confluence should be sought where the fundamental bias and the technical bias align.
This is NOT always possible so you need to manage the potential risks when all factors do not appear to align with your own analysis of the market.
Some sources include the following:
1. Central Bank speeches;
2. News feeds (Bloomberg Professional, Reuters, Ransquawk among others);
3. Economic Calendars (Banks, FF, myfxbook and hundreds of others);
4. Trading Economics website and other academic sources (sites, pdf's, relevant articles);
5. Political commentary (Tweets and speeches among others);
Avoid 'entertainment' news such as CNBC, as you will not gain any useful information in your trading setups.
Trade Duration
This will be dependent upon the movements of the market on the traded instrument and the controls that are put in place.
Trades may run for several weeks or months based on motion of the market in a certain direction or consolidation periods which avoid stop out !
Although the thread is geared towards D1 TF trading, when other TFs are traded the trade durations can vary significantly.
The idea is to get into a long trend and stay in there for hundreds of pips or as long as possible and have your trailing stop take you out.
It is an increase in trading volume via more trades that accelerates the account growth on a favorable run.
The trader will need to exercise great patience and allow trades to run as much as possible.
If a trader makes a profit on a trade then they really have not done alot wrong however, they may have foregone a greater opportunity.
Swap Rates
On a D1 (or higher) trade setup, very often the trades run over several days into weeks and perhaps over several months.
At ~5pm EST (US) rollover occurs on positions left open and either positive swap or negative swap is added to or deducted from the trading account via your broker almost instantaneously.
The swap rates are updated on a weekly basis via Financial Institution passing on rates to brokers.
Wednesday incurs a triple swap rate (markets in FX do not trade over the weekend).
Friday incurs a triple swap rate for CFD's.
Brokers may pass onto customers a financing fee.
The formula for calculating swap rates below may vary slightly from how a particular broker performs their calculations.
Note: If a broker shows 2 relatively high negative swap rates for the same currency pair, ask questions why and investigate.
The formula for calculating Swap Rate is as follows:
Daily Rollover Interest = Contract Notional Value x (Base Currency Interest Rate - Quote Currency Interest Rate) / (365 days per year x Current Base Currency Rate)
Contract Notional Value is the volume in quote currency eg EUR/USD: 100,000 (or 1 Lot) - swap will be in USD currency.
The interest rate differential is the difference in interest rates between the Base and Quote currencies.
You will need to know the lending and borrowing interest rates of the currencies you trade (many sources online).
The Daily Rollover Interest Formula calculates based on a 1 day rollover, if its more than a day then simply multiply by number of days.
Swap Rate accumulation should certainly be considered in longer term trade setups.
Keep in tune with current swap rates and have a strategy in place (if necessary) should swap rates turn negative on you in a long consolidation period because as time goes on your floating PnL can slowly get eaten away based on symbol specific swap rate profile.
Swap Rate accumulation has a meaningful impact over trades running in the markets over several months.
Candlestick Sources:
Websites:
- Basic candlestick patterns - http://www.candlesticker.com/BasicCa...s.aspx?lang=en
- Bullish candlestick patterns - http://www.candlesticker.com/Bullish...s.aspx?lang=en
- Bearish candlestick patterns - http://www.candlesticker.com/Bearish...s.aspx?lang=en
- Basic candlestick patterns - http://stockcharts.com/school/doku.p...o_candlesticks
Books:
- Candlestick Patterns for Dummies (its actually a good place to start if you are a complete novice)
- Japanese Candlestick Patterns by Steve Nison (various updated versions)
Gann Sources:
Gann, W. D. 1923. Truth of the Stock Tape;
Gann, W. D. 1927. The Tunnel Thru the Air or Looking Back from 1940;
Gann, W. D. 1936. New Stock Trend Detector;
Gann, W. D. 1946. Forecasting Grains by Time Cycles;
Gann, W. D. 1949. 45 Years in Wall Street;
Gann, W. D. 1951. How to Make Profits in Commodities; and
Gann, W. D. 1954. Why Money is Lost on Commodities and Stocks and How to Make Profits.
Harmonics:
Concentrate on the basic ABCD and AB=CD patterns as a 1 to 1 completion with an expected price reversal to follow, or at exhaustion 127.2/161.8)
http://harmonictrader.com/
AB=CD Pattern
http://harmonictrader.com/blog/2013/08/03/abcd/
Advanced harmonic patterns such as gartley, bat, crab, butterfly, shark, 3 drives, 5-0 may be applied in setups.
Fibonacci Sources:
Ratios - http://harmonictrader.com/fibonacci/fibonacci-ratios/
Extentions - http://www.investopedia.com/terms/f/...extensions.asp
Retracement - http://www.investopedia.com/terms/f/...etracement.asp
Golden ratio - http://www.investopedia.com/articles.../04/033104.asp
The sites listed above are to gain a very basic understanding of Fib ratios and may be expanded in the thread.
Fib ratios that I apply are:
38.2,
50,
61.8,
78.6,
88.6,
100,
127.2 and
161.8.
I will address within the thread what elements are important to understand and apply and those that do not fit in with the QUAD CANDLE SYSTEM.
Websites with useful content:
http://www.bloomberg.com
http://www.economiccalendar.com
http://www.reuters.com
http://www.marketwatch.com
http://www.marctomarket.com
http://www.netdania.com
http://www.zerohedge.com
https://ransquawk.com
https://tradingeconomics.com
https://finviz.com
Central banks:
http://www.centralbanksguide.com/central+banks+list/
https://www.federalreserve.gov/
http://www.bankofengland.co.uk/Pages/home.aspx
http://www.ecb.europa.eu/home/html/index.en.html
https://www.boj.or.jp/en/index.htm/
https://www.snb.ch/en/
http://www.rba.gov.au/
http://www.bankofcanada.ca/
http://www.rbnz.govt.nz/
Exchanges:
Stock:
NYSE (US) http://nyse.com/
NASDAQ (US) http://nasdaq.com/
Japan Exchange Group JPX (Japan) http://www.jpx.co.jp/english/
Shanghai Stock Exchange (China) http://www.sse.com.cn
Euronext (EU) https://www.euronext.com/
London Stock Exchange Group (UK) http://www.lseg.com/
Hong Hong Stock Exchange (HK) http://www.hkex.com.hk/
Shenzhen Stock Exchange (China) http://www.szse.cn/main/en
Deutsche Borse (Germany) http://deutsche-boerse.com/dbg/dispa...r/dbg_nav/home
TMX Group (Canada) http://www.tmx.com/
Korea Exchange (Korea) http://eng.krx.co.kr/
SIX Swiss Exchange (Switzerland) http://www.six-swiss-exchange.com/
ASX (Australia) http://www.asx.com.au/
Taiwan Stock Exchange (Taiwan) http://www.twse.com.tw/en/
New Zealand Exchange NZX (New Zealand) http://www.nzx.com/
Commodity:
Chicago Mercantile Exchange (CME, CBOT, NYMEX, COMEX) http://cmegroup.com/
U.S. Commodity Futures Trading Commission (COT Data):
http://www.cftc.gov/MarketReports/Co...ders/index.htm
Google: Search for other sources via Google/other search engines to expand your knowledge base.
QUAD GENERAL GUIDELINE FOR TRADE SETUPS
1. FIND A GROUP OF SYMBOLS USING THE QUAD CANDLE DASHBOARD (or manually)
SEARCH FOR A POTENTIAL QUAD CANDLE PATTERN (QCP) BY USING TEMPLATE:
a) Master Octive Trading Frame indicator;
b) D1 TF
2. IF SYMBOL IS NOT A MAJOR LOOK AT RELATED MAJORS ON D1 Chart
a) Example CHFJPY (Get D1 Chart for both USDCHF and USDJPY)
b) Check Correlation Table (Daily, Weekly, and Monthly)
http://www.myfxbook.com/forex-market/correlation
3. CHECK FUNDAMENTALS
(before you ever take a trade you must have a global bias direction Up, Down or Neutral (swap rate considerations))
a) Forex Factory Economic Calendar
https://www.forexfactory.com/calendar.php
MQL5 Economic Calendar
https://www.mql5.com/en/economic-calendar
b) News sites (purpose is to be as market aware as possible, this is ongoing)
Reuters
http://www.reuters.com/news
http://www.reuters.com/finance/currencies
Bloomberg
https://www.bloomberg.com/markets
https://www.bloomberg.com/markets/currencies
CNBC
https://www.cnbc.com/foreign-exchange/
4. CHECK QCP SETUP LOCATION
a) Chart structure resistance and/or support levels
b) Fibonacci Ratios (38.2 to 88.6 and extension ratios 127.2 and 161.8)
c) Harmonic completions (ABCD or AB=CD patterns)
d) Key Psychological Handles (check to see where price currently is trading with respect to these price levels)
5. CHECK QCP CANDLESTICK TYPE (SQCP and LQCP; short and long Quad Setups)
a) reversal type candlestick patterns after a long upward or downward trend;
b) look for rejection or piercing of a given candle type at a key Octive level;
c) consider lower TF analysis within the QUAD setup boundaries;
d) consider the quality of the reversal candle pattern;
e) consider the relative ranges between the D1 candles of a Quad Candle Pattern; and
f) the 'quality' of the Quad Candle Pattern
6. CHECK THE FOLLOWING
a) Day of Week an entry is likely to be made (eg if Friday not advisable, consider weekend risk)
b) Proximity to high impact news and the expected impact on a proposed entry into the market
c) Swap (check to see if the pair has positive or negative carry swap, this adds up over multiple weeks)
d) Check that the Stop and TP locations make sense
e) Know your potential maximum loss on a given trade
f) Know how you will trail the trade (ATR method, move SL to BE+ pips are X_pips, S+R etc)
g) LOOK FOR ANY REASON WHY THE TRADE SHOULD NOT BE ENTERED (is the reason strong enough to cause you to not make an entry, determine the risk based on the reason for possible rejection of a trade)
h) ASK OTHER TRADERS FROM THE THREAD IF THEY CAN THINK OF REASONS WHY YOU SHOULD NOT TAKE A GIVEN TRADE, CONSIDER THEIR REASONS AND MATCH IT TO YOUR OWN THINKING.
7. Apply sound Risk Control and Trade Management techniques
- Be clear about what you stand to lose on a given trade as a % of account (typically risk 1-2% per trade and never more than ~5%);
- Have a plan in place that locks the trade in at BE after price moves a pre-determined distance from entry level;
- Once initial SL has been determined via Octive Gap and the entry is active in the market, allow the trade room to breathe;
- Minimum SL of 1 OctiveGap;
- Maximum SL of 2 OctiveGaps;
- Target at least 4RR (ie 4 x SL pips)
- Minimize common errors in your trade setups by being thorough, check the applied risk more than once and adjust as necessary;
- Consistency over the longer term should be the aim and applying a compounding approach MoM will grow the account considerably;
- Equity Curve Trace Management (ECTM) is a technique that can be applied under episodes of drawdown;
- Becoming an excellent Risk Manager comes with Experience & Time;
- Swap Short (or Swap Long) rate;
- Spread;
- Quad Short or Quad Long Pattern (QSP/QLP) confirm pattern is valid;
- Quality of Quad Pattern (candlestick patterns, harmonic completion zones and Fibs as appropriate to the given chart);
- Location of the QSP to Chart Structure (up high, in the middle or elsewhere); and
- Location of the QSP to Octive zones (near Extreme Octive Zone or elsewhere within the Master Octive Trading Frame)
ADVANCED GANN TRADE SETUPS
Traders should understand that not a single person alive has all the information pertaining to Gann's methodologies and therefore no person can assume to know Gann's material in a complete context.
Relatively recent practitioners such as Jenkins, Beck and Murrey have all used parts of Gann's Trading Wisdom and applied slightly different interpretations or approaches.
Many so called Gann Gurus claiming to understand all of Gann's knowledge are simply fake and should be avoided at all costs if they are unable to prove real trading performance using these techniques .
I have studied and applied much of Gann's methodologies to my own trading for well over 30 years.
However, any use of Gann in my own trading methodologies (and the limited amount of posts about Gann techniques posted in this thread) are based on my own interpretations and research into Gann.
Do not be offended if I fall short of providing a fully explained version of Gann in a public forum (not likely to ever occur).
Having a very strong mathematical background allows me to adequately analyze time cycles very accurately and produce price in time charts.
These charts can be used for accurate trading on any TF from intraday through to longer term.
Trading successfully is a journey of discovery and my own research tells me that an excellent approach is one that applies what works and discards what does not work after completing a thorough and exhaustive testing and analysis process.
Risk Control and its strict application is a critical part of longer term successful trading.
Astrological Aspects (applied to the Advanced Traders Toolkit):
Planetary motions and their alignments can offer some extraordinary predictive powers in the trading space of many financial markets.
I recommend that keen students perform extensive astro cycle studies using both a Geocentric (Earth as center) and Heliocentric (Sun as center) approach to multiple Symbols across multiple time frames.
This is as simple as tracking the Major Aspects with a Moon <> Earth <> Jupiter setup overlayed on a price chart then search for major trend changes and the frequency over which they occur and how often and the quality of them.
NASA has several data sources that can be used, this data can be set in any indicator and applied in MT4/MT5 or other platform.
To be successful at applying this to the markets requires an in-depth working knowledge of astrology, planetary phases, time cycles and mathematics.
Major Aspects are provided below:
Conjunction = 0 Deg;
Sextile = 60 Deg;
Square = 90 Deg;
Trine = 120 Deg; and
Opposition = 180 Deg
Gann Grid Zones of Intersection (applied to the Advanced Traders Toolkit):
Known as GGZIs these are zones where 2 Gann lines intersect with a symbol who's PA has previously shown respect to the GG.
Powerful moves can be forecast from or towards these zones as they act as powerful forces of attraction or repulsion.
Confluent setups at the time of a Full Moon date offer potentially the most powerful short term moves.
On a D1 TF these moves are typically comprised of the 'primer' bar followed by the 'momentum' bar.
An alert trader applying reasonable risk to such a setup can make significant shorter term gains.
Gann Angles (applied to the Advanced Traders Toolkit):
45, 60, 90, 120, 180, 240, 270 and 360 degrees.
Squaring the Circle (applied to the Advanced Traders Toolkit):
The circles center is assigned the value 1 with numbers increasing in steps of 1 via a clockwise direction which continues outwards.
Projection of Price in Time (applied to the Advanced Traders Toolkit):
In the QCS Methodology what interests us most is predicting where turning points are likely to occur well out in the future.
Such zones may provide clues as to when profit taking should occur or when new setups can be considered.
Confluence is at the sole of the QCS approach because we trade with the idea of forming higher probability trade setups with favorable RR.
The use of Gann analysis complements the QCS Methodology because historically the turning points occur with uncanny accuracy.
Since the Quad Candle System is primarily geared towards trading the D1 TF the use of Gann will be provided mostly for D1 trading when it is given.
A series of projected dates will be provided in advance as a suggestion of possible turning point zones of PA in the future.
Planetary longitudes can be used in the process of squaring price in time.
Planets involved in the movements of some Symbols are:
Gold (Leo)
Saturn, Mars, Sun and Jupiter.
Silver (Cancer)
Saturn, Venus, Sun, Moon and Mars.
Currencies
Care must be exercised when applying planetary aspects and longitudes to forecast prices and their corresponding dates on many currency pairs.
By far he best approach is to perform intense studies using Planetary Aspects across several years of quality historical data and examine periods of correlation as well as periods of minor correlation.
I use a purpose built indicator which applies NASA data (several other sources are available with reasonable quality data).
Traders must dedicate a significant amount of time in attempting to master this area of trading which the main stream simply fail to understand.
I can assure all traders that mastering this topic takes time but once understood is very simple to apply and this information will be of major benefit to your trading performance over the medium to longer term horizon.
Ignored Posts (leading to Ignored Traders):
Traders MUST NOT post charts showing:
MAs,
RSI,
MACD,
Stochastics,
TDI,
CCI or
any other similar type lagging indicators.
Informative indicators are the norm here as opposed to 'lagging-type' indicators which must not be posted since they have a value of zero.
A 'trader' who posts a chart classed as an "Ignore Chart" will be given 1 warning to delete the post after which they might be ignored permanently.
IMPORTANT:
My plan is to apply trading knowledge at a simple but effective level so all can follow along and trade the QUAD CANDLE SYSTEM.
The gained knowledge from the above is simply to help a trader to form an expectation of where price is likely to go and then based on how price reacts look to take trades on a daily time frame, manage the trade throughout, apply sound risk management, protect any floating profit and gain as many pips as possible on a longer term time frame.
I have been successfully trading the financial markets (multiple instruments) since the mid-80's so there is not much I have not seen.
Several tools are likely to be coded by myself in mql4 or mql5 or C++ or Python or MATLAB or other programming languages.
FX retail trading is very much different to FX institutional trading.
Retail Traders are NOT the same as Skilled Professional Traders.
As an FX retail trader the odds of being consistently successful or successful in general are heavily stacked against the trader.
Keep an open mind and remember the system seeks longer term entries with a typically larger pip count which means that the setups require longer time periods to unfold as the market plays out its typical roller-coaster type trajectories of price in time.
If a trader seeks very short term scalping type trades then this thread may not be for you.
Show respect to your fellow traders and be mindful that this is an international community of traders.
The intention of which should be focused towards facilitating the advancement of trading knowledge.
Please refer to the thread for real transparent trading setups and links to trade analytic software as I use this approach to outline before the fact genuine trading.
Patience and exercising sound trade management and risk control is the Key to longevity in the FX business!
Note: I am not affiliated nor associated in any way with any of the listed websites, they are provided as a potential source of information only and I do not guarantee the quality of the information provided on these websites.
Please use the information at your own risk after undergoing your own due diligence!
I do not endorse the work of any other person or entity and any information in the form of websites or links is for educational purposes only.
A trader should never risk more capital than what he/she is willing to lose and that such a loss would not impact heavily on their lifestyle.
Good Trading,
MASTERRMIND ............. ![]()