Hello all...I've been wanting to start a thread like this for some time but have been busy. I want this to be a thread were we share simple and uncomplicated trade ideas and plans. I feel that the trades we post here should be so simple they are obvious to everyone.
My point is that this type of trading (the low hanging fruit - if you will) should be plenty to suffice for anyone who is looking for that consistent way to keep pushing the rock up the hill. One trade at a time. I have a particular method that I have used for many years and have been distracted by "newer" or "sexier" ways to trade...but I keep coming back to this and have decided (after a decade of bullsh--t) to keep this and leave everything else alone.
My plan is simple...sell rallies in a down trend...buy dips in an up trend...watch for ranging markets and then buy the bottom of the range...and/or sell the top of the range....that's it...no complicated oscillators...moving averages...or gee whiz indicators. I invite your participation.
For my part I plan to use weekly and daily charts as my time is very limited. Thus my trade posts will be once or twice a week. I invite you to follow along or post your own trades (keeping in mind the above). If you're going to tell me about elliot wave abc correction, or negative divergence on xyz oscillator...save it for another thread...this is just simple price chart with candle sticks and a few trend lines.
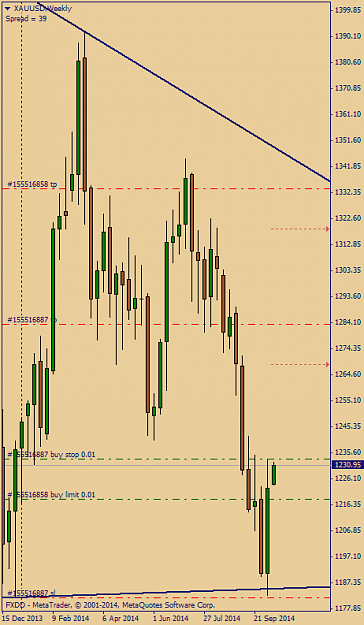
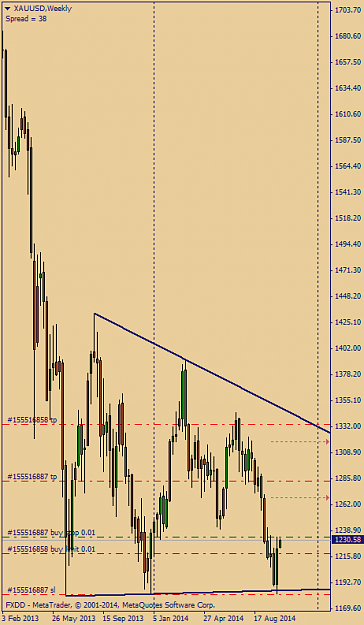
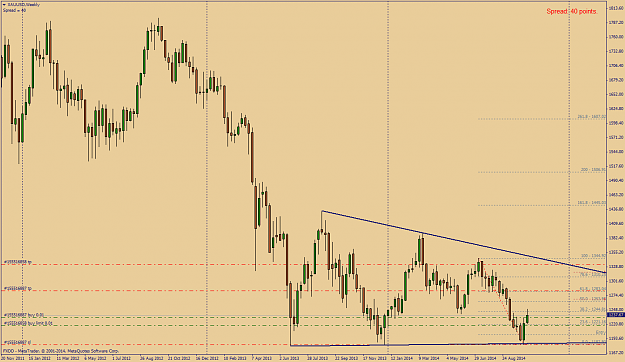
I offer this first trade to get things started. XAU/USD weekly chart. One chart is just a blow up of the other...
So here it is down dirty and simple: Price has been in a narrowing range for a little over a year, (as seen on the weekly chart). At the bottom of this range, last week's price candle created an obvious outside bar. Each of the previous two attempts in this area resulted in a significant rally. I have placed two pending orders for long and will see which ones trigger. I have two targets one 500 pips and the other 1,000 pips. (remember these are weekly candles). If these trades fail then the resumption of the bearish trend will be obvious and I will then sell the next rally at an obvious resistance level.
I will make no "Predictions" about where I think price will go or what I believe will happen in the futures...because I just don't know...the bottom line is this...in this kind of environment, this signal (engulfing bar) has an 80% accuracy rate to at least the first target...it may go more which is why I have a second target...
(as a side note I am using this thread to gather data on the hit rate for the 2nd target...but that will take some time). For now I have solid data from live forward trading on the hit rate for the signals and characteristics of the signals I will be trading here.
No big secrets or "sexy" predictions...just simple - uncomplicated - OBVIOUS trading
My point is that this type of trading (the low hanging fruit - if you will) should be plenty to suffice for anyone who is looking for that consistent way to keep pushing the rock up the hill. One trade at a time. I have a particular method that I have used for many years and have been distracted by "newer" or "sexier" ways to trade...but I keep coming back to this and have decided (after a decade of bullsh--t) to keep this and leave everything else alone.
My plan is simple...sell rallies in a down trend...buy dips in an up trend...watch for ranging markets and then buy the bottom of the range...and/or sell the top of the range....that's it...no complicated oscillators...moving averages...or gee whiz indicators. I invite your participation.
For my part I plan to use weekly and daily charts as my time is very limited. Thus my trade posts will be once or twice a week. I invite you to follow along or post your own trades (keeping in mind the above). If you're going to tell me about elliot wave abc correction, or negative divergence on xyz oscillator...save it for another thread...this is just simple price chart with candle sticks and a few trend lines.
I offer this first trade to get things started. XAU/USD weekly chart. One chart is just a blow up of the other...
So here it is down dirty and simple: Price has been in a narrowing range for a little over a year, (as seen on the weekly chart). At the bottom of this range, last week's price candle created an obvious outside bar. Each of the previous two attempts in this area resulted in a significant rally. I have placed two pending orders for long and will see which ones trigger. I have two targets one 500 pips and the other 1,000 pips. (remember these are weekly candles). If these trades fail then the resumption of the bearish trend will be obvious and I will then sell the next rally at an obvious resistance level.
I will make no "Predictions" about where I think price will go or what I believe will happen in the futures...because I just don't know...the bottom line is this...in this kind of environment, this signal (engulfing bar) has an 80% accuracy rate to at least the first target...it may go more which is why I have a second target...
(as a side note I am using this thread to gather data on the hit rate for the 2nd target...but that will take some time). For now I have solid data from live forward trading on the hit rate for the signals and characteristics of the signals I will be trading here.
No big secrets or "sexy" predictions...just simple - uncomplicated - OBVIOUS trading
Attached Image(s) (click to enlarge)