I am going to share a good majority of my trades here by posting my Before and Final chart images.
Anyone here is encouraged to share anything they want to. Keep it appropriate. Trading related things only.
I will also include a Skill Developement work sheet along with my "Final " chart images.(typed or from power point)
It will include basic information that will include:
-Trade Criteria Met?
-Pre-Planned?
ENTRY:
-Followed Entry Tactics?
-Precision Entry?
RISK:
-Position Size Correctly?
-Stop Placed?
-Stop At Good Location?
EXIT:
- Followed Exit Tactic?
- Precision Exit?
ANALYSIS:
- Did I study my trade?
These will all be judged by YES or No answers. I will keep it simple so that I don't make my common mistakes.
I am not allowed to think during a trade because I will have a predetermined plan in place before entry.
I will look for obvious and compelling setups for entries.
Stops will be based off of my entry Supply and Demand levels.
Targets will vary widely as to allow profits to run.
I will not preconcieve the possible direction of a trend change. (Meaning I will not trade against the trend until confirmation of a HH/LL, or at the extreme on the curve)
I use Daily, Hourly, and 5min charts most of the time.
-Daily charts are for trend direction.
- Hourly charts are for finding Supply and Demand Levels.
- And 5min charts are used for setting up my entries.
New traders are welcome but I am asking that you have an understanding of Supply and Demand. You do not have to be an expert. Just know the difference between Supply and Demand compared to Support and Resistance.
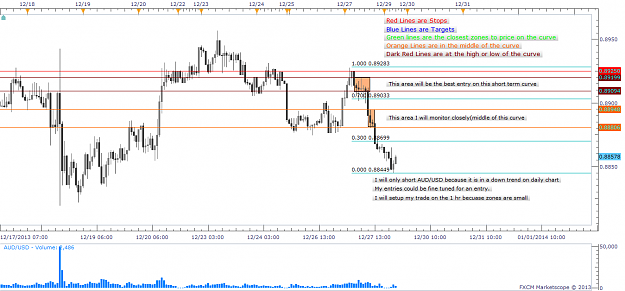
I will help with understanding the curve on the chart and what it means for your trading tactics depending on where you enter on the curve.
I will also help with fine tuning your line placement for Supply and Demand levels.
Please include a chart image so that I can see what you are seeing, to help with your trades and trading skills.
Do not hesitate to help someone else here.
Always Give CREDIT to where it is DUE.
[highlight=rgb(255, 0, 0)]Revised 01/02/2014:[/highlight] If I do not get to your questions right away it doesn't mean i am ignoring you. I am just busy.
[highlight=rgb(255, 0, 0)]Revised 01/02/2014:[/highlight] I am usually on between 6am Mountain time(Or 13:00GMT) to 3 or 4pm Mountain time(or22:00 or 23:00GMT)
[highlight=rgb(255, 0, 0)]Revised 01/22/2014:[/highlight]This is my examples of how to rate a Zone before Setting an Entry
Revised 02/09/2014: This is my Trade rules and Daily Trade Procedures (the first page on the Daily procedures is what I am constantly referencing to before each trade)Attachment
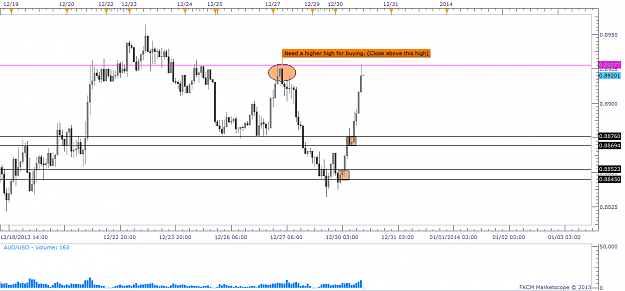
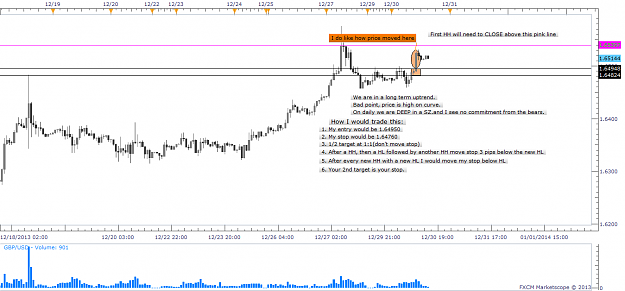
Revised 02/23/2014: These are examples I use to determine trend change and where a zone is on the curve.
Anyone here is encouraged to share anything they want to. Keep it appropriate. Trading related things only.
I will also include a Skill Developement work sheet along with my "Final " chart images.(typed or from power point)
It will include basic information that will include:
-Trade Criteria Met?
-Pre-Planned?
ENTRY:
-Followed Entry Tactics?
-Precision Entry?
RISK:
-Position Size Correctly?
-Stop Placed?
-Stop At Good Location?
EXIT:
- Followed Exit Tactic?
- Precision Exit?
ANALYSIS:
- Did I study my trade?
These will all be judged by YES or No answers. I will keep it simple so that I don't make my common mistakes.
I am not allowed to think during a trade because I will have a predetermined plan in place before entry.
I will look for obvious and compelling setups for entries.
Stops will be based off of my entry Supply and Demand levels.
Targets will vary widely as to allow profits to run.
I will not preconcieve the possible direction of a trend change. (Meaning I will not trade against the trend until confirmation of a HH/LL, or at the extreme on the curve)
I use Daily, Hourly, and 5min charts most of the time.
-Daily charts are for trend direction.
- Hourly charts are for finding Supply and Demand Levels.
- And 5min charts are used for setting up my entries.
New traders are welcome but I am asking that you have an understanding of Supply and Demand. You do not have to be an expert. Just know the difference between Supply and Demand compared to Support and Resistance.
I will help with understanding the curve on the chart and what it means for your trading tactics depending on where you enter on the curve.
I will also help with fine tuning your line placement for Supply and Demand levels.
Please include a chart image so that I can see what you are seeing, to help with your trades and trading skills.
Do not hesitate to help someone else here.
Always Give CREDIT to where it is DUE.
[highlight=rgb(255, 0, 0)]Revised 01/02/2014:[/highlight] If I do not get to your questions right away it doesn't mean i am ignoring you. I am just busy.
[highlight=rgb(255, 0, 0)]Revised 01/02/2014:[/highlight] I am usually on between 6am Mountain time(Or 13:00GMT) to 3 or 4pm Mountain time(or22:00 or 23:00GMT)
[highlight=rgb(255, 0, 0)]Revised 01/22/2014:[/highlight]This is my examples of how to rate a Zone before Setting an Entry
Attached File(s)
Revised 02/09/2014: This is my Trade rules and Daily Trade Procedures (the first page on the Daily procedures is what I am constantly referencing to before each trade)Attachment
Attached File(s)
Attached File(s)
Revised 02/23/2014: These are examples I use to determine trend change and where a zone is on the curve.
Attached File(s)