!!!UPDATE!!!
Topic Closed
Learn from your failures - and don't trade Live till your master of your mind.
I have blown my Live account - as many other traders - Teh system proved to be fine, but I am failing mentally to follow my own rules. I am not gonna update the thread, to make others get to the same shit as I am now. Lucky that money was already my profit from aprevious account, so I am actualy at 0% now - but that was enough, I am gonna start over again.... Once....
***********************************************************************************************************************
Dear Traders,
Let me introduce you the secret behind the Divergences that I am almost sure you have not seen before.
Let me add, that this discussion/trading system is mostly for those who basically understand the CCi itself and the divergences.
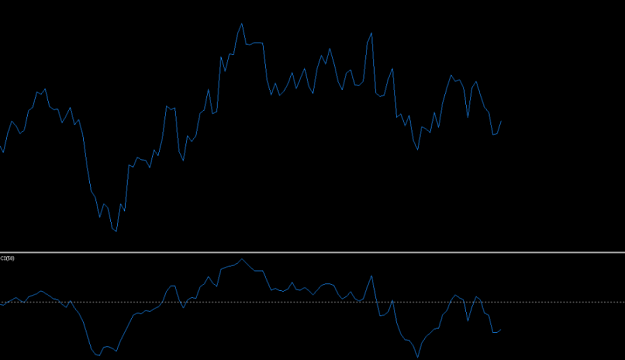
For a fast reference, let me attach a picture and a short description of the "generally" known divergences.
I think the picture is telling you everything you need to know for your basic tradings.
But what you are about to see below is a very special way of understanding the divergences. I would say, they are great indications for resistance or support levels. And these indications are coming sometimes 20 candles before, so you have time to setup your entry.
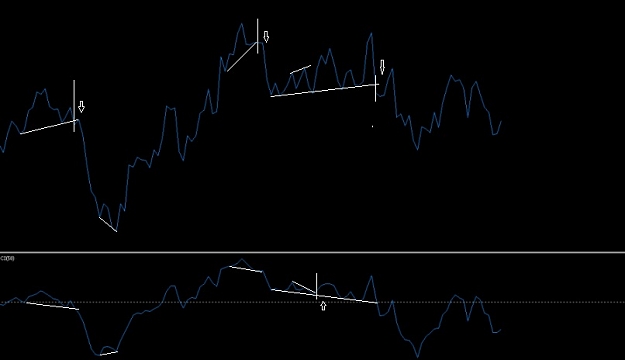
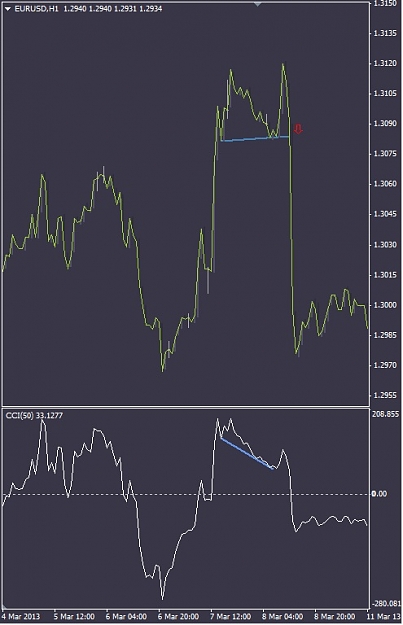
Let me show you an example of a basic Divergence setup, then I'll show you the "behind the scenes" part.
So here you can see a great fall after a strong up movement, the divergence clearly indicates the down movement. As a home work, I am intrested how would you trade this? When would be your entry. (Leave a comment later on with the title 1# example, and of course you can draw your entry)
So, I showed you how is it looks like based on the big book. Now let me show you something else. This little example holds 2 more things for us.
So this one shows us a hidden bullish divergence that realy gave another pusing to the price. It went up as it should. (I am also intrested what would be your entry for this long?, leave a comment just as for the 1st example if you wish)
So, We can say that both divergences worked as they should. But let me now show you, something, that I believe is the real reason of that "fall".
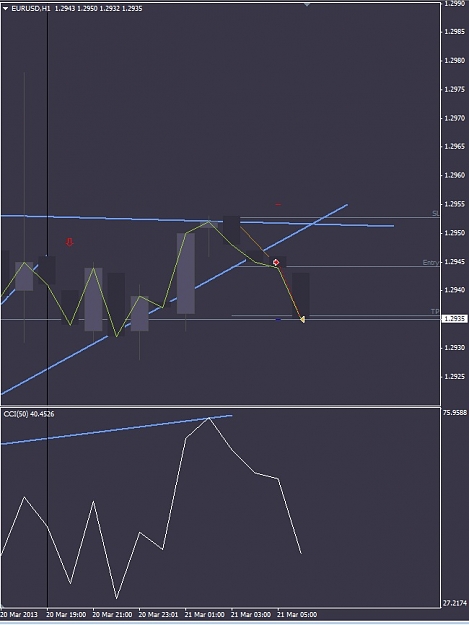
So basically I have just expanded the trend line of the hidden divergence and when the price broke it, the short trade got into action.
The main Idea is now in a few words, extend the divergence.
Entries:
Long: Divergence set on "tops/peaks" both on chart and indicator
Short: Divergence set on "bottoms/lows" both on chart and indicator
In the next posts I am gonna add some screens about these setups so they can be examined.
The main Idea behond this thread is to find together the best way of trading this method.
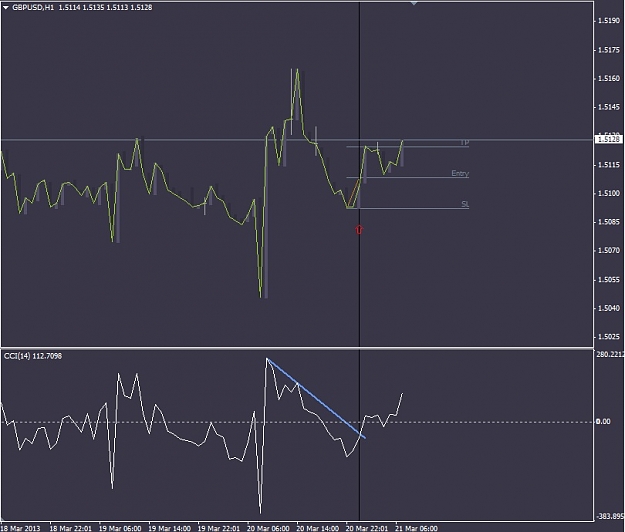
At the moment what I do is as a SL I am using the last Peak or Bottom for my trades.
The TP is a bit hard to describe, but I'll show it on my screenshots.
Stay with me if you are intrested.
Topic Closed
Learn from your failures - and don't trade Live till your master of your mind.
I have blown my Live account - as many other traders - Teh system proved to be fine, but I am failing mentally to follow my own rules. I am not gonna update the thread, to make others get to the same shit as I am now. Lucky that money was already my profit from aprevious account, so I am actualy at 0% now - but that was enough, I am gonna start over again.... Once....
***********************************************************************************************************************
Dear Traders,
Let me introduce you the secret behind the Divergences that I am almost sure you have not seen before.
Let me add, that this discussion/trading system is mostly for those who basically understand the CCi itself and the divergences.
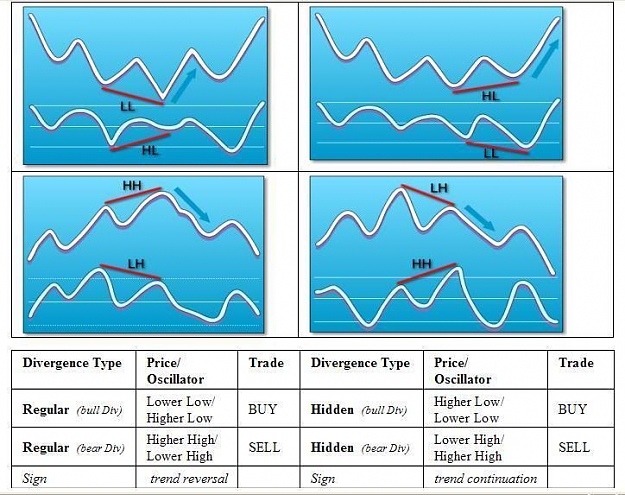
For a fast reference, let me attach a picture and a short description of the "generally" known divergences.
Attached Image (click to enlarge)
I think the picture is telling you everything you need to know for your basic tradings.
But what you are about to see below is a very special way of understanding the divergences. I would say, they are great indications for resistance or support levels. And these indications are coming sometimes 20 candles before, so you have time to setup your entry.
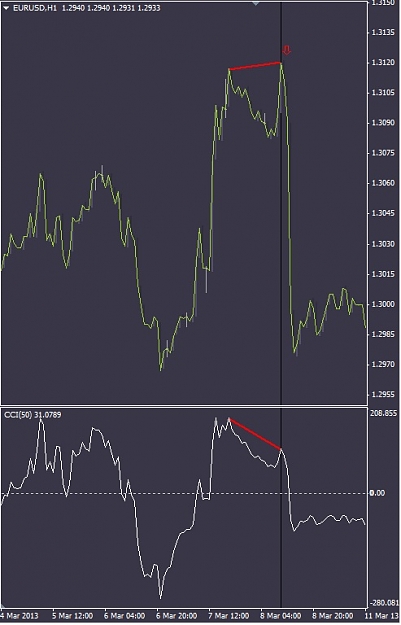
Let me show you an example of a basic Divergence setup, then I'll show you the "behind the scenes" part.
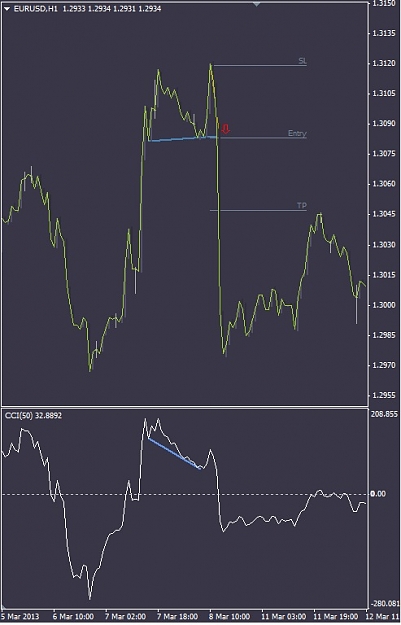
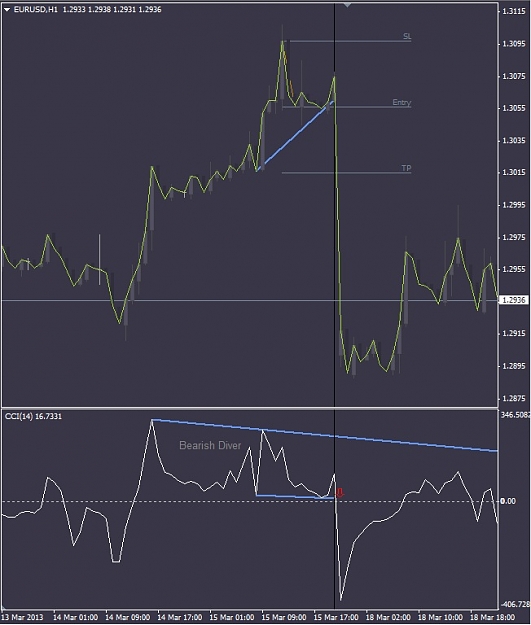
Attached Image (click to enlarge)
So here you can see a great fall after a strong up movement, the divergence clearly indicates the down movement. As a home work, I am intrested how would you trade this? When would be your entry. (Leave a comment later on with the title 1# example, and of course you can draw your entry)
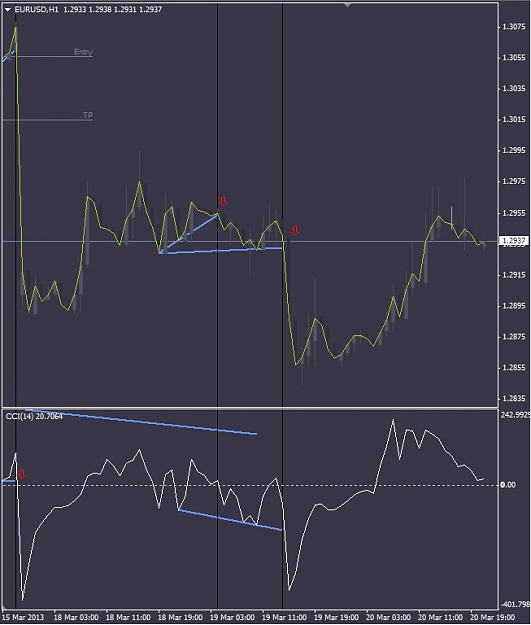
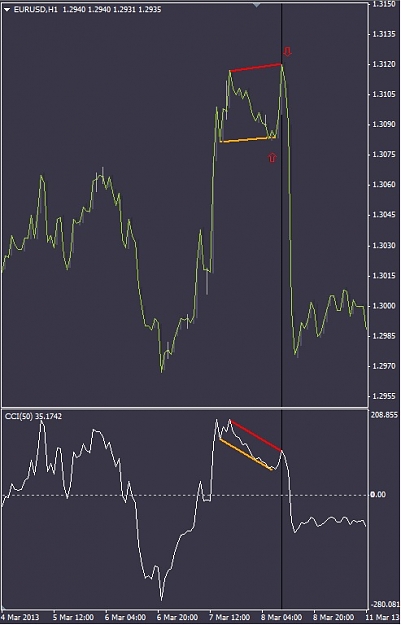
So, I showed you how is it looks like based on the big book. Now let me show you something else. This little example holds 2 more things for us.
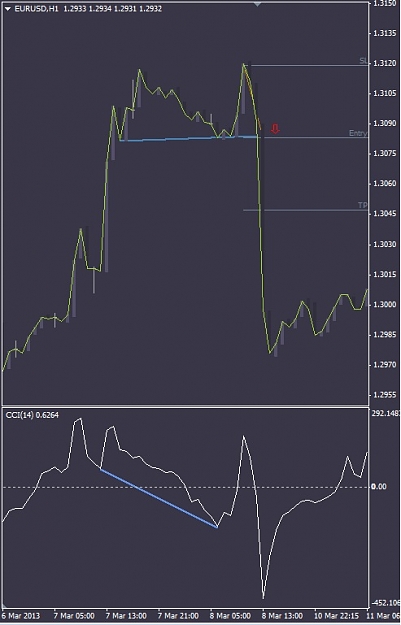
Attached Image (click to enlarge)
So this one shows us a hidden bullish divergence that realy gave another pusing to the price. It went up as it should. (I am also intrested what would be your entry for this long?, leave a comment just as for the 1st example if you wish)
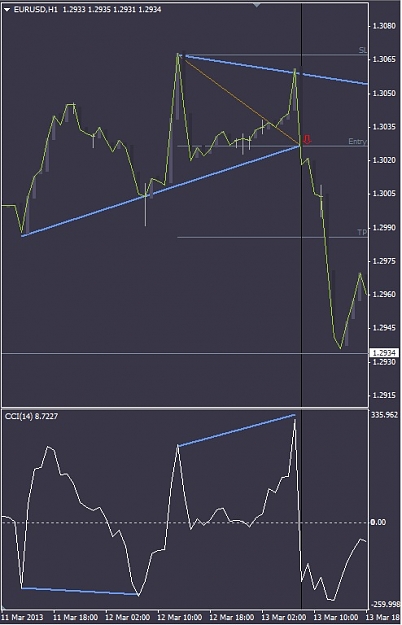
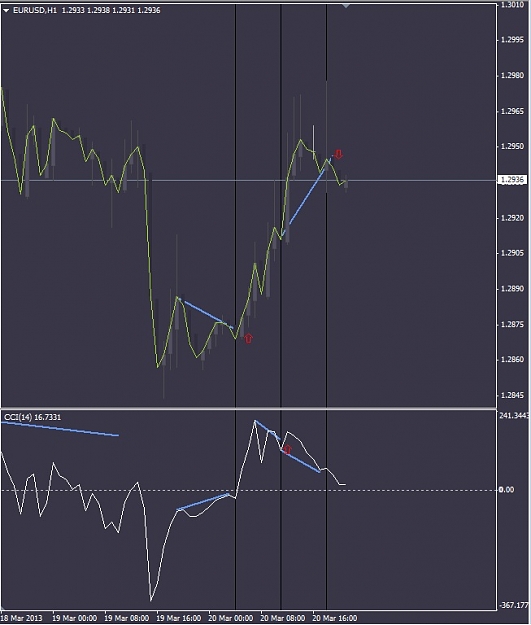
So, We can say that both divergences worked as they should. But let me now show you, something, that I believe is the real reason of that "fall".
Attached Image (click to enlarge)
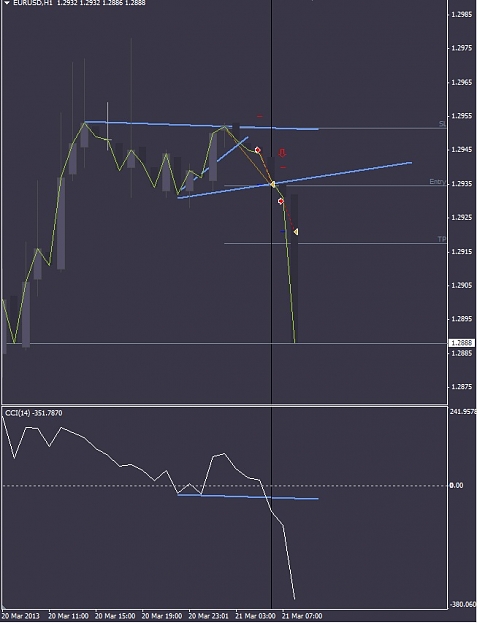
So basically I have just expanded the trend line of the hidden divergence and when the price broke it, the short trade got into action.
The main Idea is now in a few words, extend the divergence.
Entries:
Long: Divergence set on "tops/peaks" both on chart and indicator
Short: Divergence set on "bottoms/lows" both on chart and indicator
In the next posts I am gonna add some screens about these setups so they can be examined.
The main Idea behond this thread is to find together the best way of trading this method.
At the moment what I do is as a SL I am using the last Peak or Bottom for my trades.
The TP is a bit hard to describe, but I'll show it on my screenshots.
Stay with me if you are intrested.