INDICATOR VALUE
STOCH (14)
↑ 40.67
RSI (14)
↑ 45.23
MACD (9)
↑ -21.32
PAR SAR (9)
↓ 1691.49
EMA (20)
↓ 1667.39
EMA (50)
↓ 1690.63
RANGE
1630.00 – 1660.00
Support Resistance
1 1620.00 1686.40
2
1600.00 1700.00
Short Medium Long ---------S2 S1 Pivot Point R1 R2
Bearish Neutral Bullish1622.40 1637.85 1650.05 1665.50 1677.70
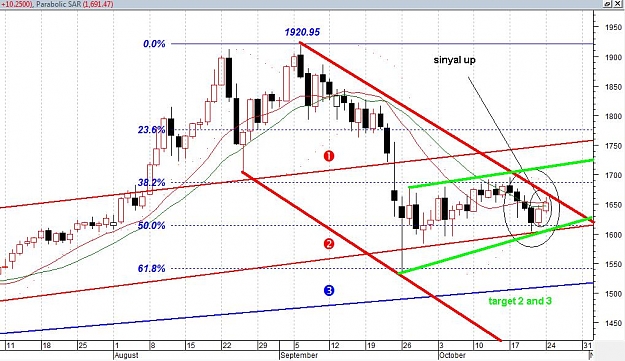
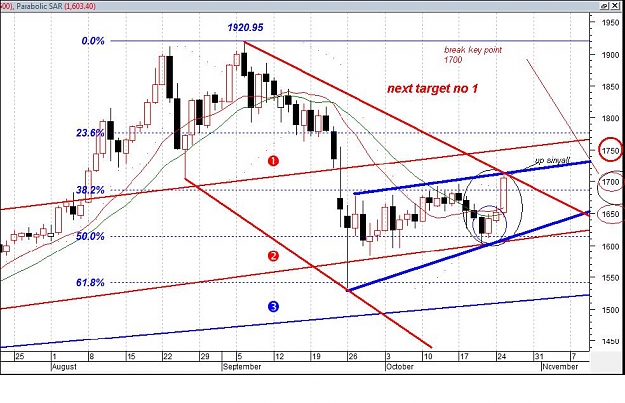
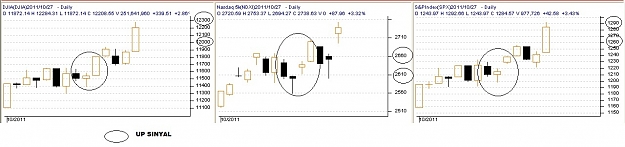
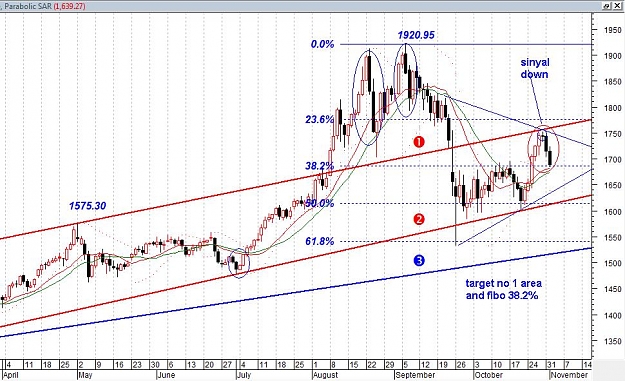
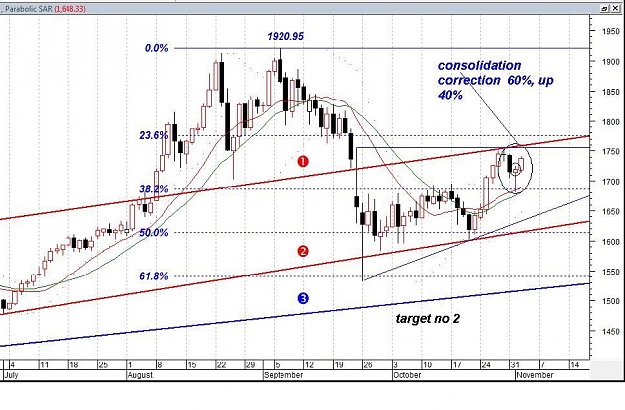
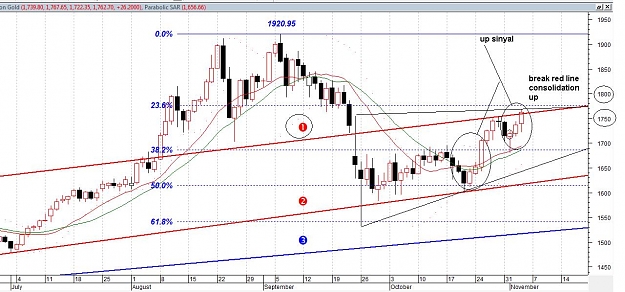
gold stay in consolidation up with correction
if stay in area 1658-1662 sinyal up R1
if stay in area 1647-1640 sinyal down S1
FIBONACCI VALUE
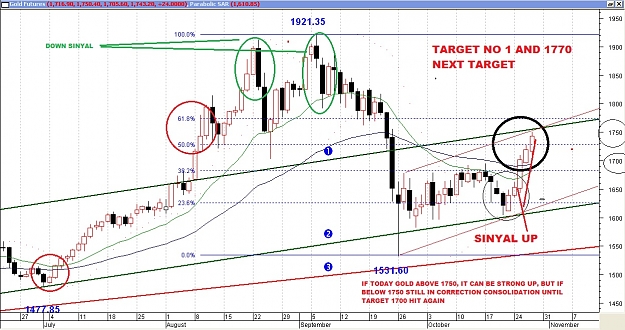
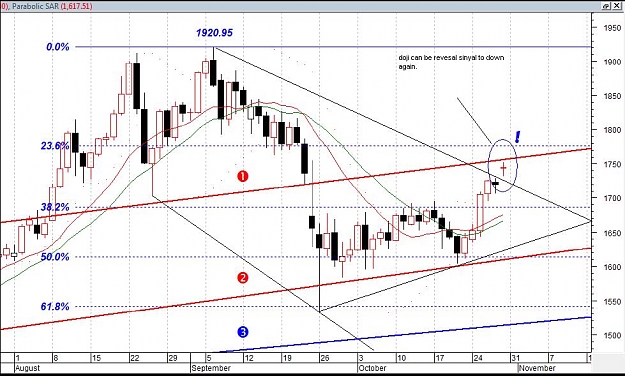
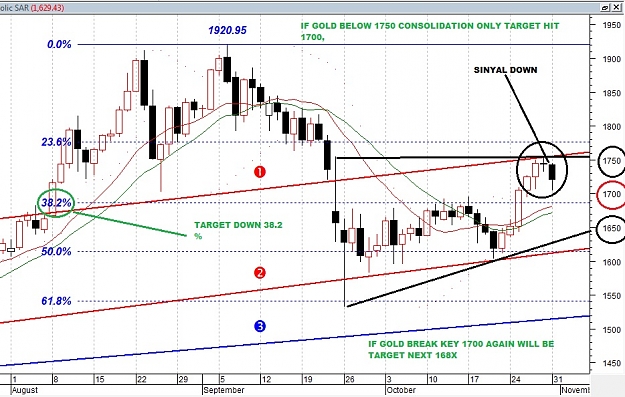
0.0% 1920.95
23.6%
1776.06
38.2%
1686.42 target
50.0%
1613.98 target
61.8%
1541.53
100.0% 1307.00
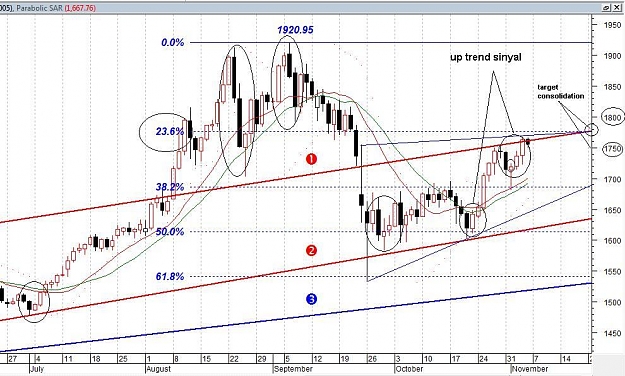
* Recovery is shown still relatively thin, probably sideways pattern
will still continue in session today with the 38.2% Fibonacci resistance scale
retracement and important support at the trendline 2. In addition, gold is also
can move to follow the pattern of up-channel line (composed of trendline 1 & 2).
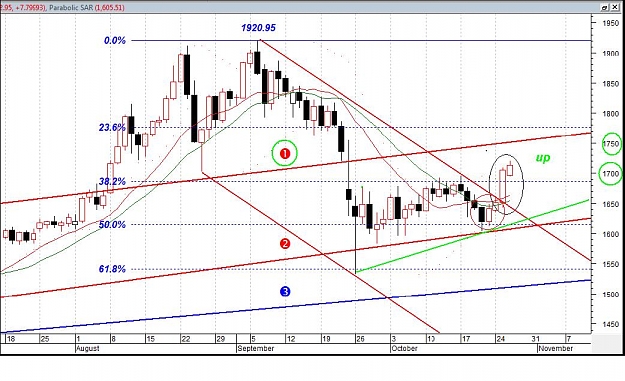
* If the movement of gold was observed within 2 years (early
2010 - present), confirming a bullish signal is still strong.
Reference to detect the emergence of a bearish trend change (downtrend)
least able to go beyond the trendline 3 in areas with strong 1500s.
So this needs to be addressed carefully.
news
UPDATE 1-AngloGold CEO sees no bubble in gold price - Reuters Africa, Oct 24 2011 11:45PM
China Money Rate Jumps Most in a Month as PBOC Drains Capital - Bloomberg, Oct 24 2011 11:28PM
sory for late ![]() i'm sick ..
i'm sick ..![]()