INDICATOR VALUE
STOCH (14) ↑ 22.16 up again position
RSI (14) ↑ 50.60 potensial up
MACD (9) ↓ 14.08 correction
PAR SAR (9) ↓ 1906.10 still correction
EMA (20) ↓ 1810.86
EMA (50) ↑ 1748.39
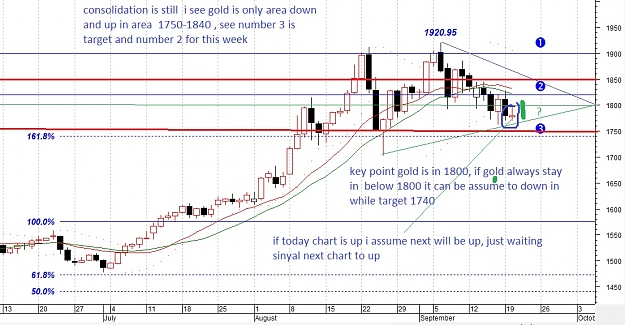
RANGE gold 1750.00 – 1810.00
Support Resistance
1 1740.00 1800.00
2 1720.00 1820.00
----------- S2 S1 Pivot Point R1 R2----------
1751.85 1777.50 1794.65 1820.30 1837.45
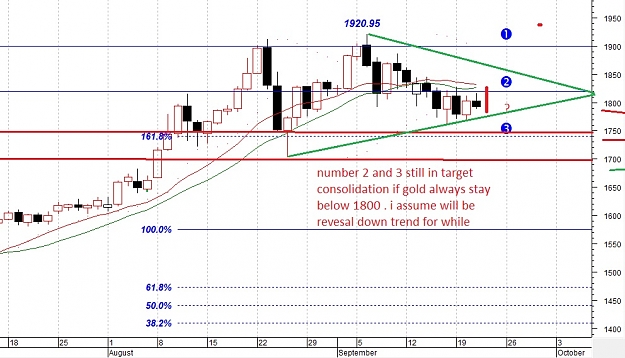
i ' m assume today gold will be consolidation to up but indicator still in correction if gold stay in above 1800 it can be sinyal up again but while
if gold stay in area 1810-1815 sinyal up to R1
if gold stay in area 1888-1882 sinyal down to S1 and S2 target
FIBONACCI VALUE
0.0% 1307.45
50.0% 1441.38
61.8% 1472.98
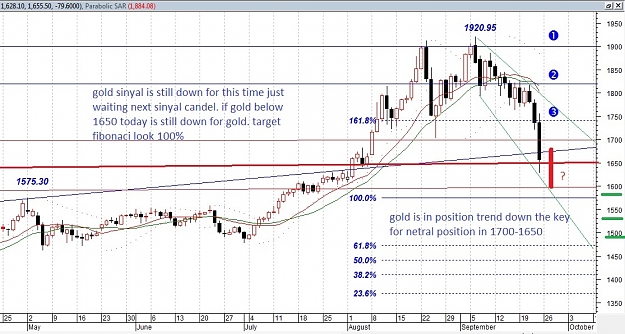
100.0% 1575.30
161.8% 1740.83
261.8% 2008.68
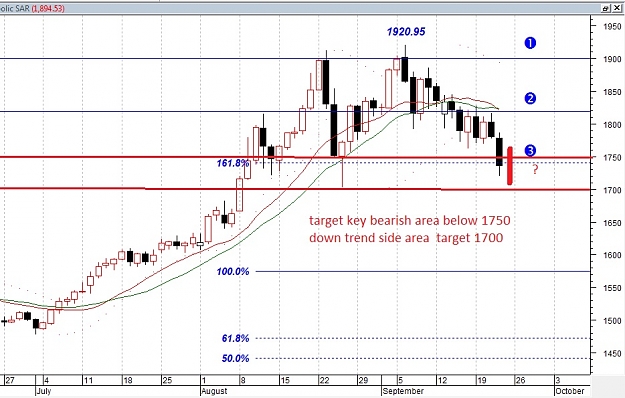
* Since the price closed below the 1800 level again, a tendency to move
strong negative return, which marks the likely price of trying to
limited to fine-tune the phase of consolidation in the area between 1740
until the 1900s.
* Expectations of the above has been described in some outlook
previously. Midline (equilibrium) remained in 1820, as a reference for
power to detect the direction of short-term (daily). If exceeded, usually right
confirm or amplify the signal (continuous).
NEWS
Rising Gold Prices Spawn "New Gold Rush" in the West - New American, Sep 20 2011 6:04PM
U.S. Stocks Retreat Amid Greek Concern - Bloomberg, Sep 20 2011 4:35PM
Gold miners help drive TSX to higher close - Reuters, Sep 20 2011 5:34PM
Pan American Silver Short term Bullish Reversal - Traders Huddle, Sep 20 2011 6:34PM
if you want to see my chart . sign up to be member
STOCH (14) ↑ 22.16 up again position
RSI (14) ↑ 50.60 potensial up
MACD (9) ↓ 14.08 correction
PAR SAR (9) ↓ 1906.10 still correction
EMA (20) ↓ 1810.86
EMA (50) ↑ 1748.39
RANGE gold 1750.00 – 1810.00
Support Resistance
1 1740.00 1800.00
2 1720.00 1820.00
----------- S2 S1 Pivot Point R1 R2----------
1751.85 1777.50 1794.65 1820.30 1837.45
i ' m assume today gold will be consolidation to up but indicator still in correction if gold stay in above 1800 it can be sinyal up again but while
if gold stay in area 1810-1815 sinyal up to R1
if gold stay in area 1888-1882 sinyal down to S1 and S2 target
FIBONACCI VALUE
0.0% 1307.45
50.0% 1441.38
61.8% 1472.98
100.0% 1575.30
161.8% 1740.83
261.8% 2008.68
* Since the price closed below the 1800 level again, a tendency to move
strong negative return, which marks the likely price of trying to
limited to fine-tune the phase of consolidation in the area between 1740
until the 1900s.
* Expectations of the above has been described in some outlook
previously. Midline (equilibrium) remained in 1820, as a reference for
power to detect the direction of short-term (daily). If exceeded, usually right
confirm or amplify the signal (continuous).
NEWS
Rising Gold Prices Spawn "New Gold Rush" in the West - New American, Sep 20 2011 6:04PM
U.S. Stocks Retreat Amid Greek Concern - Bloomberg, Sep 20 2011 4:35PM
Gold miners help drive TSX to higher close - Reuters, Sep 20 2011 5:34PM
Pan American Silver Short term Bullish Reversal - Traders Huddle, Sep 20 2011 6:34PM
if you want to see my chart . sign up to be member
Attached Image (click to enlarge)
langsung WA aja bro update