Greetings all,
The method I am about to explain is not full proof, nothing is in trading. Now I would like for you to think about every aspect of my method and try it on your charts while applying your minds to it. I call it “my” method because this is how I trade. It is by no means something I have created. It is just information I have sorted out of all the tons of info one gets throughout a career in trading. So it is bits and pieces from here and there that make up what I live off of.
To it then,
1- When I look at a daily chart, what sticks out more than anything else to me is the fact that price tends to travel from one 500 point to the next. So I have a grid like structure on my charts showing 1000 and 500 points. Those I consider to be my major horizontal lines. I also break up every 500 area into minor 250 and 125 points. For example, EURUSD, I have 1.40000, 1.45000 and 1.50000 as major lines; and in those I have, 1.41250, 1.42500, 1.43750, 1.46250, 1.47500 & 1.48750. The red font numbers are the minor 250 and the black ones are the 125.
2- Weekly charts are where I derive my trading week bias from, however a lot can happen in one week, so I tend to be very flexible with my bias. The reason being, daily charts to me are telling the now and today story. What I look for on the weekly is either a strong rejection candle off of the major lines of the grid or a bold close above/below the major lines.
3- PA
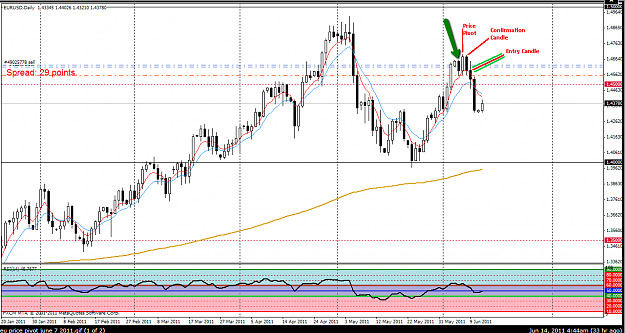
This is something that can be talked about at length. What I like to see is convincing price pivots (NOT PIVOT POINTS) signaling a change in direction be it short term or not, it does not really matter as long as I get in it where I should. Below is a picture showing Price Pivots.
Now a price pivot is said to be confirmed once the third candle (aka confirmation candle) closes. A long entry in the case of a pivot low should be at the open of the fourth candle, BUT I wait it out until I get a good retrace into the swing from pivot low to the high of the confirmation candle because I have a thing about big drawdowns especially since most days in PA tend to retrace quite a bit before continuing their way IF THEY DO. Also I tend to trade more than one pair at once because price pivots once in one pair appear in many other simultaneously, and the entry in the retrace zone will help keep one’s mind in check not to mention heavy drawdown before the trade will go in favor. So what I do is place a Fib retracement from the pivot low to the high of the confirmation candle, then drop down to a 1h or 30m chart and wait for another (but should be) good looking price pivot. Once I get that combination off of the 61.8 or 50 or 38.2 level I enter my trade at the fourth candle and at market. I also sometimes can enter in the 100-61.8 zone if I like the PA and get a good looking price pivot. What this does is give me most of the time an entry at a better price with a smaller stop compared to the open of the day. Sometimes price will just run away in my direction from the open. I do not chase it I just disregard this pair no matter how good it looks. I insist on having my retrace...
4- I use a few indicators as well:
- EMA 5 & 10 both at the close
- EMA 200 close
- RSI 14
- Recently I have started using a currency strength meter that helps pick out the pairs. But I only used it with confirmation of price pivots. We can discuss this further at a later time.
My favorite would be the RSI because it tells a lot about PA. I mainly use it for divergence, hidden divergence and trend identification with entry confirmation to name a few. I have learned to love RSI and to respect it the most among the many indicators out there. For example in a bull market RSI will fluctuate between 40 and 90, it will then come down to the 40-50 zone for support then continue its bullish trend. The reverse is true for a bear market where it will fluctuate between 10 and 60 with 50-60 acting as resistance. There are many more ways to trade using RSI, but for now I will content myself with this.
5- Stops & TP
I usually place a hard stop ten pips below the daily pivot low and then trail my stop to the low of every subsequent daily candle that follows the successful entry. TP if you want to place one can be any of the major or minor lines, depending on PA. TP is really a personal preference, I like to stay in a trade as long as possible until the market takes me out or once I get a convincing opposite price pivot.
I will post a few screen shots as soon as I have more time, this way you can piece it all together. I think this method has a lot of potential, and I would like for everyone who is interested to participate in this thread to make this method better.
Note: What was discussed here was related to a pivot low, the exact opposite would apply for a pivot high.
Regards
Chantal
The method I am about to explain is not full proof, nothing is in trading. Now I would like for you to think about every aspect of my method and try it on your charts while applying your minds to it. I call it “my” method because this is how I trade. It is by no means something I have created. It is just information I have sorted out of all the tons of info one gets throughout a career in trading. So it is bits and pieces from here and there that make up what I live off of.
To it then,
1- When I look at a daily chart, what sticks out more than anything else to me is the fact that price tends to travel from one 500 point to the next. So I have a grid like structure on my charts showing 1000 and 500 points. Those I consider to be my major horizontal lines. I also break up every 500 area into minor 250 and 125 points. For example, EURUSD, I have 1.40000, 1.45000 and 1.50000 as major lines; and in those I have, 1.41250, 1.42500, 1.43750, 1.46250, 1.47500 & 1.48750. The red font numbers are the minor 250 and the black ones are the 125.
2- Weekly charts are where I derive my trading week bias from, however a lot can happen in one week, so I tend to be very flexible with my bias. The reason being, daily charts to me are telling the now and today story. What I look for on the weekly is either a strong rejection candle off of the major lines of the grid or a bold close above/below the major lines.
3- PA
This is something that can be talked about at length. What I like to see is convincing price pivots (NOT PIVOT POINTS) signaling a change in direction be it short term or not, it does not really matter as long as I get in it where I should. Below is a picture showing Price Pivots.
Now a price pivot is said to be confirmed once the third candle (aka confirmation candle) closes. A long entry in the case of a pivot low should be at the open of the fourth candle, BUT I wait it out until I get a good retrace into the swing from pivot low to the high of the confirmation candle because I have a thing about big drawdowns especially since most days in PA tend to retrace quite a bit before continuing their way IF THEY DO. Also I tend to trade more than one pair at once because price pivots once in one pair appear in many other simultaneously, and the entry in the retrace zone will help keep one’s mind in check not to mention heavy drawdown before the trade will go in favor. So what I do is place a Fib retracement from the pivot low to the high of the confirmation candle, then drop down to a 1h or 30m chart and wait for another (but should be) good looking price pivot. Once I get that combination off of the 61.8 or 50 or 38.2 level I enter my trade at the fourth candle and at market. I also sometimes can enter in the 100-61.8 zone if I like the PA and get a good looking price pivot. What this does is give me most of the time an entry at a better price with a smaller stop compared to the open of the day. Sometimes price will just run away in my direction from the open. I do not chase it I just disregard this pair no matter how good it looks. I insist on having my retrace...
4- I use a few indicators as well:
- EMA 5 & 10 both at the close
- EMA 200 close
- RSI 14
- Recently I have started using a currency strength meter that helps pick out the pairs. But I only used it with confirmation of price pivots. We can discuss this further at a later time.
My favorite would be the RSI because it tells a lot about PA. I mainly use it for divergence, hidden divergence and trend identification with entry confirmation to name a few. I have learned to love RSI and to respect it the most among the many indicators out there. For example in a bull market RSI will fluctuate between 40 and 90, it will then come down to the 40-50 zone for support then continue its bullish trend. The reverse is true for a bear market where it will fluctuate between 10 and 60 with 50-60 acting as resistance. There are many more ways to trade using RSI, but for now I will content myself with this.
5- Stops & TP
I usually place a hard stop ten pips below the daily pivot low and then trail my stop to the low of every subsequent daily candle that follows the successful entry. TP if you want to place one can be any of the major or minor lines, depending on PA. TP is really a personal preference, I like to stay in a trade as long as possible until the market takes me out or once I get a convincing opposite price pivot.
I will post a few screen shots as soon as I have more time, this way you can piece it all together. I think this method has a lot of potential, and I would like for everyone who is interested to participate in this thread to make this method better.
Note: What was discussed here was related to a pivot low, the exact opposite would apply for a pivot high.
Regards
Chantal
Attached Image