I found this indicator just a simple volume indi, providing somehow without source code some one has hacked it to add more confluent confirming checks so ppl can switch on/off if they want to use.
due to chenge in meta base codes it now has several problems:
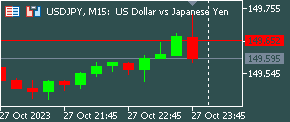
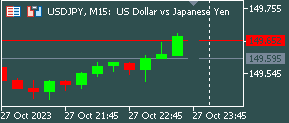
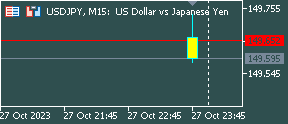
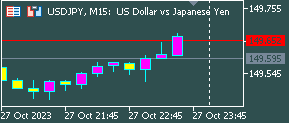
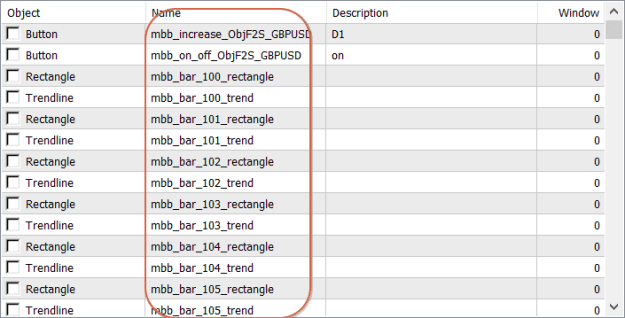
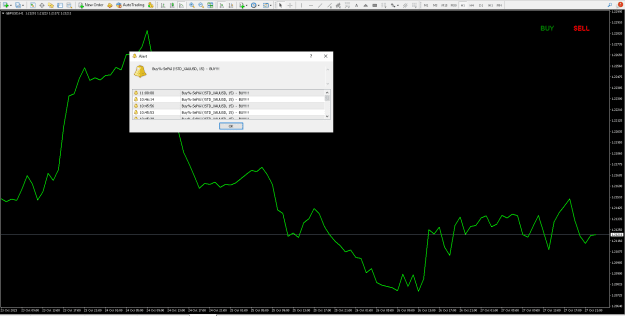
1/ the buy sell tiles appear but not the percentge value, changing background to balck/white still not help
2/reading sell buy from the comment window is not a good methode, and can freeze the metatrader if change in price/volume is too large and too often, a weakness in meta trader, it can not discharged the many warning alarms itself, anf often meta appears with frozen grey comment window in critical time where we need to access chart data, hence I have to disable the alert, to prevent that frozen state happens + x
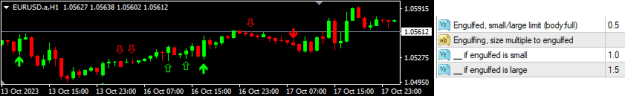
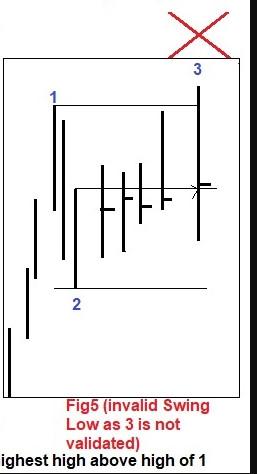
3/ how can we display the arrows buy if BUY volume >75% and arrow sell on chart if SELL volume >75%, it should not display too many arrows, but only when signal changed like following
a/ an BULL engulfing candle has appeared whilst BUY volume was reported >75%
b/ an BEAR engulfing candle has appeared whilst SELL volume was reported >75%
(arrows only appear when signal changed from one side to the other )
Could an expert correct the code so that it can be useful again please. One more times I tried to modified some code but I think to give up. it took me all the times with no respectable result. I hope someone could manage to do the job
due to chenge in meta base codes it now has several problems:
1/ the buy sell tiles appear but not the percentge value, changing background to balck/white still not help
2/reading sell buy from the comment window is not a good methode, and can freeze the metatrader if change in price/volume is too large and too often, a weakness in meta trader, it can not discharged the many warning alarms itself, anf often meta appears with frozen grey comment window in critical time where we need to access chart data, hence I have to disable the alert, to prevent that frozen state happens + x
3/ how can we display the arrows buy if BUY volume >75% and arrow sell on chart if SELL volume >75%, it should not display too many arrows, but only when signal changed like following
a/ an BULL engulfing candle has appeared whilst BUY volume was reported >75%
b/ an BEAR engulfing candle has appeared whilst SELL volume was reported >75%
(arrows only appear when signal changed from one side to the other )
Could an expert correct the code so that it can be useful again please. One more times I tried to modified some code but I think to give up. it took me all the times with no respectable result. I hope someone could manage to do the job
Attached Image (click to enlarge)
Attached File(s)