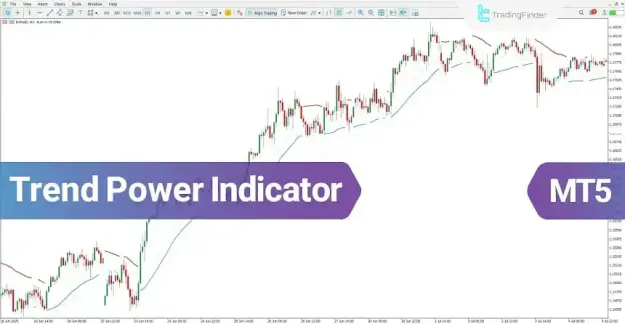
Its straightforward visual design makes it suitable for traders seeking to identify trend continuation opportunities, potential reversals, and strategic market entry points across various financial instruments.
 You can download it from this link:
https://cdn.tradingfinder.com/file/5...-mt5-tflab.zip
 You can also access the MetaTrader 4 version of this Indicator through this page:
https://www.metalsmine.com/thread/14...r-4-free-tflab
 For instructions on how to install:
https://www.forexfactory.com/thread/...-in-metatrader
Prop Firm DrawDown Protector : Prop Firm Capital Protection Expert MT5 |Forex Money Management: Forex Trade Management Expert MT5 | ICT Concepts Indicator MT5 |Smart Money Concepts Expert MT5 | Smart Money Trap Scanner | Get a free Expert Advisor license via Telegram and WhatsApp
Trend Power Indicator Specifications
Indicator Categories
- Signal & Forecast MT5 Indicators
- Trading Assistant MT5 Indicators
- Moving Average MT5 Indicators
Platform
- MetaTrader 5
Skill Level
- Beginner to Intermediate
Indicator Classification
- Trend Reversal Indicator
Timeframe Compatibility
- Multi-Timeframe Analysis
Trading Approaches
- Scalping
- Day Trading
- Swing Trading
Supported Assets
- Forex Currency Pairs
- Cryptocurrencies
- Stocks and Indices
How the Trend Power Indicator Works
The Trend Power Indicator utilizes a dynamic trend line that changes color according to prevailing market momentum and directional strength.
The indicator provides the following market signals:
- A blue trend line indicates bullish conditions and strengthening upward momentum.
- A red trend line signals bearish conditions and increasing downward pressure.
- A fragmented or intermittent line formation around price bars suggests a consolidation period or a ranging market environment.
This visual representation enables traders to assess market conditions quickly and efficiently.
Bullish Trend Analysis
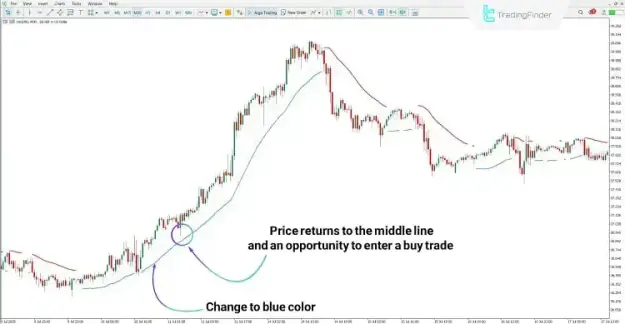
On the 30-minute XAG/USD chart, the transition of the indicator line to blue signals the development of a bullish market structure.
As the uptrend progresses, temporary price pullbacks toward the central trend line may create favorable buying opportunities. When price rejects this area and resumes its upward trajectory, traders can consider potential long entries aligned with the prevailing trend.
Evaluating Bullish Momentum
The blue trend line confirms that buyers maintain control of the market and that positive momentum remains intact.
Potential Buy Conditions
Buy opportunities may emerge when:
- The indicator line remains blue.
- Price retraces toward the trend support area.
- Bullish price action develops near the pullback zone.
- The upward trend resumes with increasing momentum.
Bearish Trend Analysis
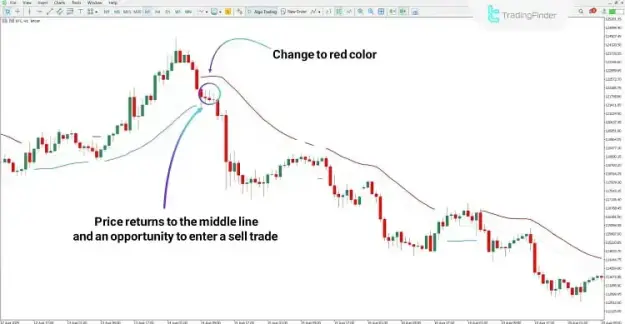
On the 1-hour Bitcoin (BTC) chart, the appearance of a red trend line reflects growing selling activity and the establishment of a downward trend.
During bearish market phases, corrective rallies toward the indicator's central trend level may provide suitable opportunities for short-selling positions.
Evaluating Bearish Momentum
The red trend line highlights market weakness and confirms that sellers are dominating price action.
Potential Sell Conditions
Sell opportunities may emerge when:
- The indicator line remains red.
- Price retraces toward the trend resistance area.
- Bearish confirmation appears after the retracement.
- Downward momentum resumes in the direction of the primary trend.
Trend Power Indicator Settings
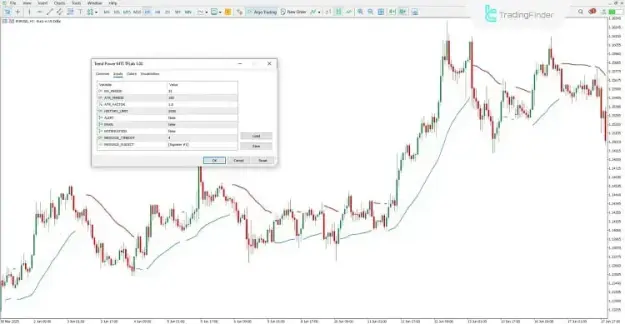
The indicator offers several adjustable inputs that allow traders to customize its sensitivity and signal generation according to their trading strategy.
Input Parameters
- MA_PERIOD – Defines the calculation period of the Moving Average.
- ATR_PERIOD – Specifies the period used for Average True Range calculations.
- ATR_FACTOR – Determines the ATR multiplier applied to the indicator.
- ALERT – Enables or disables alert generation.
- EMAIL – Activates email notifications.
- NOTIFICATION – Sends push notifications to connected devices.
- MESSAGE_TIMEOUT – Sets the interval between alert messages.
- MESSAGE_SUBJECT – Customizes the title of generated notifications.
Conclusion
The Trend Power Indicator is a comprehensive MT5 trading tool designed to identify trend direction and measure market momentum using a combination of Moving Average and Average True Range (ATR) calculations.
Through its color-changing trend line, the indicator provides a clear representation of bullish and bearish market phases while helping traders locate potential buy and sell opportunities. Its adaptability across multiple markets and timeframes makes it an effective solution for trend-following and momentum-based trading strategies.