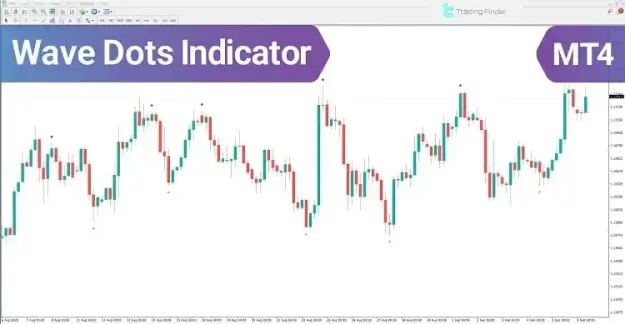
The indicator generates two types of reversal signals:
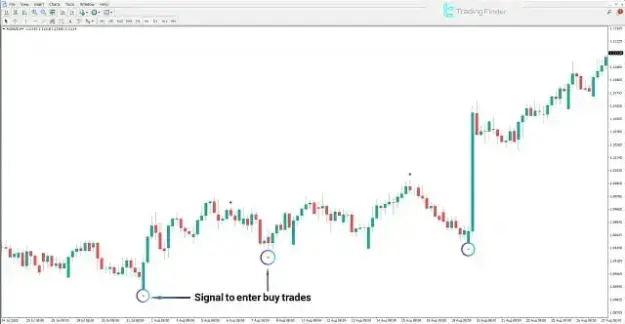
- Green Dot: Appears below the candle to indicate oversold conditions and a potential bullish reversal.
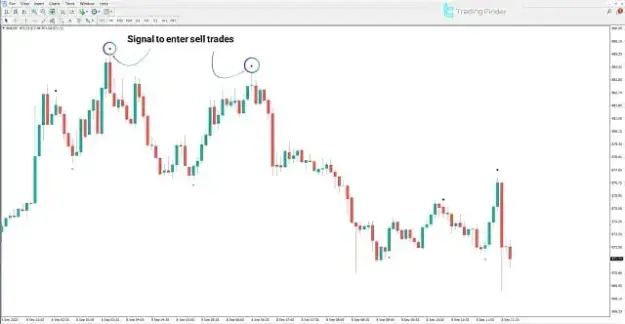
- Red Dot: Appears above the candle to signal overbought conditions and a possible bearish reversal.
Its easy-to-read visual signals enable traders to evaluate market momentum and reversal opportunities at a glance.
 You can download it from this link:
https://cdn.tradingfinder.com/file/5...4-by-tflab.zip
 For instructions on how to install:
https://www.forexfactory.com/thread/...-in-metatrader
Prop Firm DrawDown Protector : Prop Firm Capital Protection Expert MT4 | Forex Money Management: Forex Trade Management Expert MT4 |ICT Concepts Indicator MT4 | Smart Money Concepts Expert MT4| Smart Money Trap Scanner | Get a free Expert Advisor license via Telegram and WhatsApp
Wave Dots Indicator Specifications
Indicator Categories
- Signal & Forecast MT4 Indicators
- Trading Assist MT4 Indicators
Trading Platform
- MetaTrader 4
Recommended Experience
- Beginner
Indicator Classification
- Overbought and Oversold MT4 Indicators
- Reversal MT4 Indicators
Compatible Timeframes
- Multi-Timeframe
Trading Method
- Intraday Trading
Supported Financial Markets
- Forex
- Cryptocurrency
- Stock Market
Wave Dots Indicator Overview
The Wave Dots Indicator helps simplify market analysis by identifying areas where trends may be approaching exhaustion. Rather than depending on multiple oscillators or momentum indicators, traders can interpret the colored dots as visual confirmation of potential shifts in buying and selling pressure.
These signals can assist traders in recognizing possible reversal zones before a new price movement develops, making the indicator useful for both trend-following and reversal trading strategies.
Main Advantages
- Displays buy and sell signals directly on the price chart.
- Identifies potential overbought and oversold conditions.
- Highlights possible bullish and bearish reversals.
- Easy to understand and apply for traders of all experience levels.
- Suitable for various trading instruments and chart timeframes.
Wave Dots Indicator During Bullish Trends
Buy Signal
When prices decline within an overall uptrend and the market becomes oversold, the Wave Dots Indicator places a green dot below the corresponding candle.
This signal suggests that selling momentum may be weakening and buyers could begin regaining control of the market. Many traders consider this an opportunity to prepare for long positions after confirming the signal with price action or additional technical indicators.
The indicator is particularly effective at identifying buying opportunities during temporary retracements within established upward trends.
Wave Dots Indicator During Bearish Trends
Sell Signal
As buying activity becomes excessive, the indicator plots a red dot above the candle to indicate that the market may be entering an overbought condition.
This warning often suggests that bullish momentum is fading and a downward correction or bearish reversal could follow. Traders frequently use these signals to protect profits from long trades or to identify potential short-selling opportunities.
Wave Dots Indicator Settings
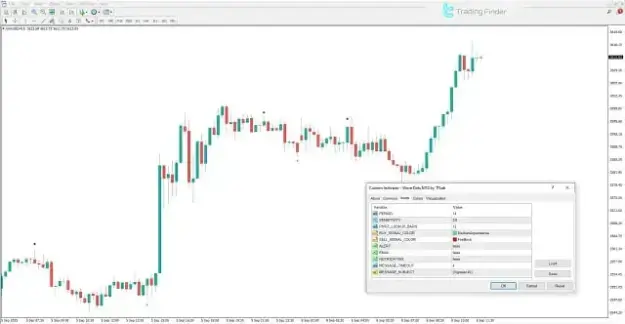
The indicator offers multiple adjustable settings that enable traders to customize its performance according to their trading strategy and market conditions.
Available Settings
- PERIOD: Defines the calculation period used for signal generation.
- SENSITIVITY: Controls how responsive the indicator is to price changes.
- PIVOT_LOOKUP_BARS: Determines the number of previous candles used to detect pivot points.
- BUY_SIGNAL_COLOR: Sets the display color of bullish signals.
- SELL_SIGNAL_COLOR: Sets the display color of bearish signals.
- ALERT: Enables visual trading alerts.
- EMAIL: Sends signal notifications by email.
- NOTIFICATION: Activates mobile push notifications.
- MESSAGE_TIMEOUT: Specifies how long alert messages remain on the screen.
- MESSAGE_SUBJECT: Defines the subject line of notification messages.
Conclusion
The Wave Dots Indicator for MT4 is an efficient technical analysis tool that helps traders detect potential market reversals using straightforward visual signals. Green dots indicate possible buying opportunities after oversold conditions, while red dots highlight areas where overbought conditions may lead to bearish price movements.
With its intuitive interface, customizable settings, and compatibility with Forex, cryptocurrencies, and stock markets, the Wave Dots Indicator is a practical solution for traders seeking more accurate trade entries and exits. Whether incorporated into an existing trading system or used as a standalone reversal indicator, it provides valuable insight into changing market momentum and potential trend shifts.