By recognizing momentum extremes in the market, traders can use these signals alongside trend analysis to improve entry and exit decisions.
 You can download it from this link:
https://cdn.tradingfinder.com/file/5...4-by-tflab.zip
 For instructions on how to install:
https://www.forexfactory.com/thread/...-in-metatrader
Prop Firm DrawDown Protector : Prop Firm Capital Protection Expert MT4 | Forex Money Management: Forex Trade Management Expert MT4 |ICT Concepts Indicator MT4 | Smart Money Concepts Expert MT4| Smart Money Trap Scanner | Get a free Expert Advisor license via Telegram and WhatsApp
RSI Overbought Oversold Indicator Features
The indicator is designed to support various trading methods and can be applied across multiple financial markets and timeframes.
Indicator Categories
- Currency Strength Indicators for MT4
- Trading Assistance Indicators for MT4
Platform Support
- MetaTrader 4 (MT4)
Experience Level
- Beginner to Advanced Traders
Indicator Classification
- Overbought and Oversold Indicators
- Market Reversal Indicators
Timeframe Compatibility
- Multi-Timeframe Trading
Recommended Trading Methods
- Day Trading
- Scalping Strategies
- Swing Trading
Supported Trading Assets
- Forex Currency Pairs
- Cryptocurrencies
- Equities and Stocks
How the RSI Overbought Oversold Indicator Works
The indicator analyzes RSI values in real time and identifies areas where the market may be overstretched. Once these conditions are detected, visual arrows are plotted on the chart to alert traders of possible reversal zones.
Signal interpretation is straightforward:
- Blue arrows indicate oversold market conditions.
- Red arrows indicate overbought market conditions.
These visual cues help traders quickly recognize potential trading setups without performing extensive manual analysis.
Bullish Trading Conditions
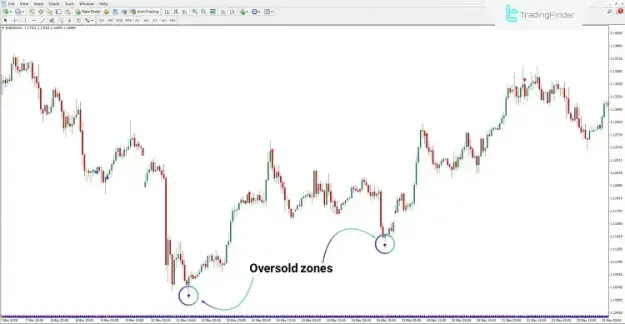
In the EUR/USD one-hour chart example, the indicator detected several oversold areas and marked them with blue arrows.
Since the broader trend was moving upward, these signals suggested potential buying opportunities where traders could anticipate a continuation of bullish momentum.
Using the Indicator in an Uptrend
During bullish market phases, oversold signals often occur after temporary pullbacks. The indicator assists traders in locating these retracement zones and identifying potential long-entry positions.
Bearish Trading Conditions
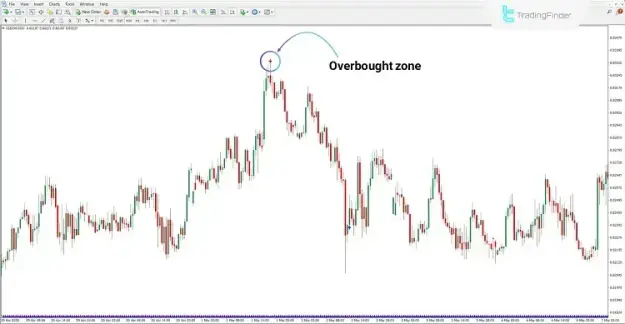
On the USD/CHF 30-minute chart, the indicator identified an overbought condition and displayed a red arrow above the price action.
In a bearish environment, overbought conditions may indicate weakening bullish pressure and the possibility of a downward market reversal.
Using the Indicator in a Downtrend
The indicator helps traders spot potential selling opportunities by highlighting overbought areas that frequently appear before bearish price movements.
RSI Overbought Oversold Indicator Settings
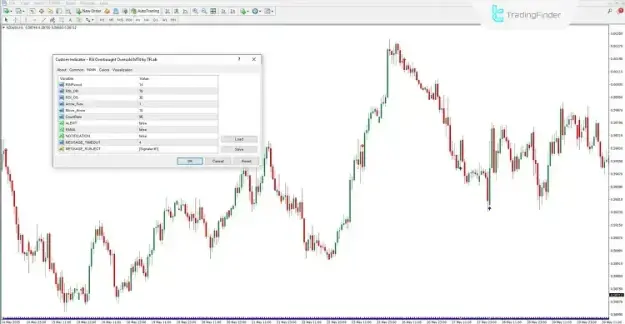
The indicator includes a variety of customizable inputs that enable traders to tailor signal generation and alert behavior according to their trading preferences.
Customizable Parameters
- RSIPeriod: Sets the RSI calculation period.
- RSI_OB: Defines the overbought level.
- RSI_OS: Defines the oversold level.
- Arrow_Size: Adjusts the size of signal arrows.
- Move_Arrow: Controls the distance between arrows and candlesticks.
- CountBars: Determines the number of candles included in calculations.
- ALERT: Enables on-screen alert notifications.
- EMAIL: Sends trading alerts via email.
- NOTIFICATION: Activates push notifications.
- MESSAGE_TIMEOUT: Specifies the interval between alerts.
- MESSAGE_SUBJECT: Defines the title of alert messages.
Advantages of the RSI Overbought Oversold Indicator
Core Benefits
- Automatically detects overbought and oversold conditions.
- Provides clear visual signals through color-coded arrows.
- Helps identify potential market reversal zones.
- Compatible with multiple timeframes and trading styles.
- Suitable for Forex, cryptocurrency, and stock market analysis.
- Offers customizable alert and notification features.
- Simplifies decision-making for both novice and professional traders.
- Enhances market timing when combined with trend analysis.
Conclusion
The RSI Overbought Oversold Indicator is a reliable MT4 indicator that utilizes RSI calculations to identify potential market extremes. Through its visual arrow-based signaling system, traders can quickly recognize overbought and oversold zones that may lead to significant price reversals.
When integrated with broader market analysis and sound risk management practices, the indicator can become a valuable component of a comprehensive trading strategy, helping traders identify higher-quality opportunities across a wide range of financial markets.