https://cdn.tradingfinder.com/file/5...4-by-tflab.zip
https://www.forexfactory.com/thread/...-in-metatrader
Prop Firm DrawDown Protector : Prop Firm Capital Protection Expert MT4 | Forex Money Management: Forex Trade Management Expert MT4 |ICT Concepts Indicator MT4 | Smart Money Concepts Expert MT4| Smart Money Trap Scanner | Get a free Expert Advisor license via Telegram and WhatsApp
Indicator Overview and Core Functionality
The Machine Learning Trendlines Clustering Indicator is designed to identify valid trendlines by processing historical price data through intelligent clustering techniques. It detects price zones where market behavior shows statistical similarity and constructs trendlines based on these grouped movements.
This methodology enhances traditional technical analysis by introducing a data-driven approach to support and resistance identification.
Key Features and Market Applications
This indicator is widely adopted in professional trading environments due to its integration of machine learning with price action analysis.
- Employs clustering algorithms to efficiently group price data
- Utilizes linear regression to generate dynamic trendlines
- Suitable for both breakout and reversal signal detection
- Supports multi-timeframe analysis for flexible trading strategies
- Applicable across multiple financial markets, including:
- Forex currency pairs
- Cryptocurrency markets
- Stock markets
Machine Learning Trendlines Clustering Indicator at a Glance
This indicator automatically identifies trendlines by analyzing clustered price behavior and detecting zones where price repeatedly reacts. It then plots corresponding support and resistance levels directly on the chart.
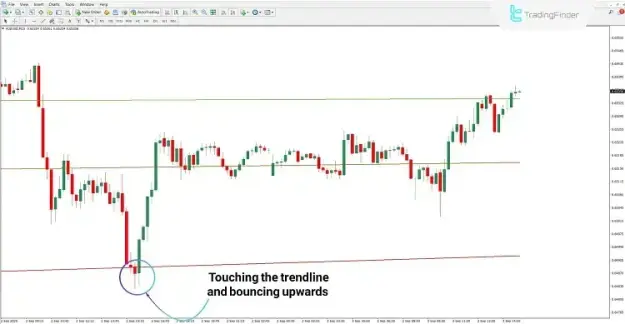
Uptrend Scenario
In bullish market conditions, the indicator detects upward trendlines that function as dynamic support levels. When price interacts with these levels, it often rebounds upward, confirming trend continuation.
- Price touches trendline and rebounds upward
- Support zones are clearly defined through clustered price behavior
- Repeated interactions reinforce bullish trend continuation
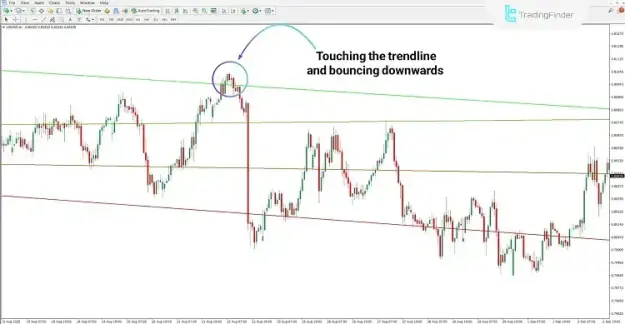
Downtrend Scenario
In bearish conditions, the indicator identifies downward trendlines that act as resistance levels. Price reactions at these levels typically result in downward movement.
- Trendline functions as resistance
- Price rejection occurs at key levels
- Repeated resistance confirms downtrend continuation
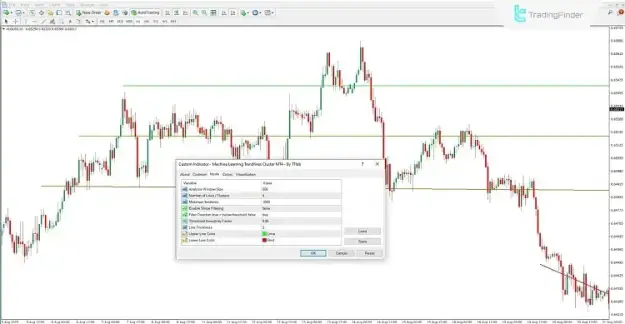
Indicator Settings and Configuration
The Machine Learning Trendlines Clustering Indicator offers customizable parameters to optimize performance based on trading style and market conditions.
- Analysis Window Size: Defines the number of candles included in the analysis
- Number of Lines/Clusters: Determines how many trendlines or clusters are generated
- Maximum Iterations: Sets the maximum number of algorithm computation cycles
- Enable Slope Filtering: Activates filtering based on trendline slope conditions
- Filter Direction: Defines whether filtering applies above or below a threshold
- Threshold Sensitivity Factor: Controls sensitivity of trendline filtering logic
- Line Thickness: Adjusts the visual thickness of plotted trendlines
- Upper Line Color: Sets color for resistance trendlines
- Lower Line Color: Sets color for support trendlines
Conclusion
The Machine Learning Trendlines Clustering Indicator is a sophisticated analytical tool that enhances traditional technical analysis by integrating machine learning algorithms and regression modeling.
By clustering similar price behaviors and automatically generating structured trendlines, it provides traders with more precise support and resistance levels. This makes it highly effective for identifying breakouts, trend continuations, and market reversals across multiple financial instruments.