In addition to identifying overall market direction, this indicator evaluates signal strength using widely recognized tools such as MACD and Stochastic. It is applicable across multiple asset classes, including forex, cryptocurrencies, and equities.
https://cdn.tradingfinder.com/file/6...4-by-tflab.zip
https://www.forexfactory.com/thread/...-in-metatrader
Prop Firm DrawDown Protector : Prop Firm Capital Protection Expert MT4 | Forex Money Management: Forex Trade Management Expert MT4 |ICT Concepts Indicator MT4 | Smart Money Concepts Expert MT4| Smart Money Trap Scanner | Get a free Expert Advisor license via Telegram and WhatsApp
Specification of the Probability Meter Trend Indicator
Indicator Classification
- Signal & Forecast MT4 Indicators
- Currency Strength MT4 Indicators
- Trading Assistance MT4 Indicators
Platform Compatibility
- MetaTrader 4 (MT4)
Skill Requirement
- Beginner Level
Indicator Type
- Reversal Indicator
Timeframe Support
- Multi-Timeframe Analysis
Trading Approaches
- Day Trading
- Scalping
- Swing Trading
Supported Markets
- Forex
- Cryptocurrency
- Stock Market
Overview of the Probability Meter Indicator
The Probability Meter Indicator delivers trading signals through a combination of percentage values and color-coded elements. It first determines the dominant market direction and then assigns a numerical strength to that signal.
- Market direction is categorized as Long (Buy) or Short (Sell)
- Signal strength is displayed as a percentage
- Additional indicators provide confirmation through visual signals
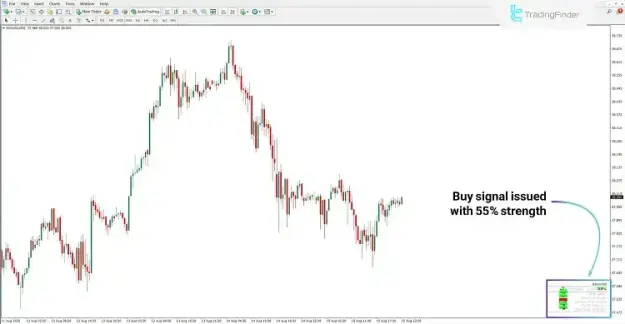
Bullish Market Condition
Under bullish conditions:
- A Long (Buy) signal is generated
- Signal strength is presented as a percentage (e.g., 55%)
- MACD and Stochastic indicators confirm upward momentum
- Green visual cues support the bullish interpretation
This configuration indicates a potential upward trend supported by multiple technical factors.
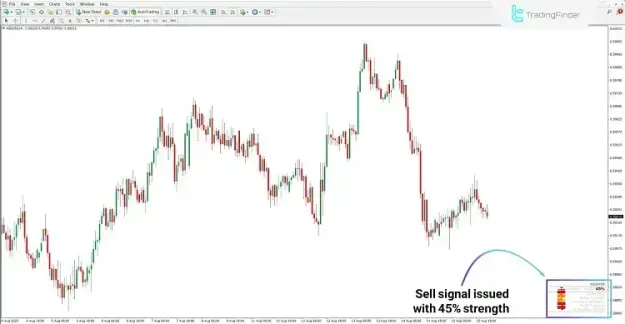
Bearish Market Condition
Under bearish conditions:
- A Short (Sell) signal is issued
- Signal strength is indicated as a percentage (e.g., 45%)
- Supporting indicators validate the downward movement
- Visual markers emphasize bearish pressure
This setup reflects a higher probability of declining prices.
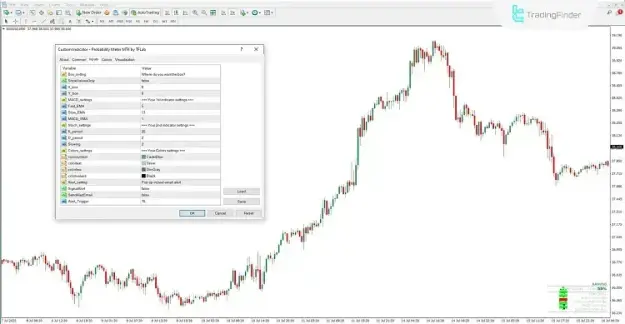
Probability Meter Indicator Settings
Box Configuration
- ShowValuesOnly: Displays only numerical data without graphical elements
- X_box: Controls horizontal placement of the display panel
- Y_box: Controls vertical placement of the display panel
MACD Parameters
- Fast_EMA: Defines the fast EMA period
- Slow_EMA: Defines the slow EMA period
- MACD_SMA: Specifies the signal line period
Stochastic Parameters
- K_period: Determines the %K calculation period
- D_period: Determines the %D calculation period
- Slowing: Applies smoothing to the oscillator
Visual Customization
- Colorsymbol: Sets the color of icons and symbols
- Colorfont: Defines text color
- Colorline: Adjusts line colors
- Colorvalues: Controls the appearance of percentage values
Alert Configuration
- SignalAlert: Activates on-screen alerts
- SendAlertEmail: Enables email notifications
- Alert_Trigger: Sets the threshold level for alerts
Conclusion
The Probability Meter Indicator is a robust trading tool that enhances market analysis by combining several technical indicators into a single probability-based framework.
- Determines market direction as Buy or Sell
- Measures signal strength using percentage values
- Utilizes MACD and Stochastic for confirmation
- Provides clear and actionable visual outputs
By applying multi-timeframe analysis and probability metrics, this indicator equips traders with a systematic method for identifying high-probability trading opportunities across diverse financial markets.