Once a pattern is recognized, it is accurately positioned on the chart and labeled with its corresponding abbreviation. To improve visual clarity, buy signals are displayed in blue, while sell signals are shown in red, each represented with distinct graphical markers for efficient interpretation.
https://cdn.tradingfinder.com/file/5...5-by-tflab.zip
https://www.metalsmine.com/thread/13...r-for-mt4-free
https://www.forexfactory.com/thread/...-in-metatrader
Prop Firm DrawDown Protector : Prop Firm Capital Protection Expert MT5 |Forex Money Management: Forex Trade Management Expert MT5 | ICT Concepts Indicator MT5 |Smart Money Concepts Expert MT5 | Smart Money Trap Scanner | Get a free Expert Advisor license via Telegram and WhatsApp
Indicator Classification
Categories
- Price Action Indicators for MT5
- Signal & Forecast Indicators for MT5
- Candlestick Pattern Indicators for MT5
Platform
- MetaTrader 5 (MT5)
Skill Level
- Beginner (Elementary)
Indicator Type
- Reversal-Based Indicator
Supported Timeframes
- Multi-Timeframe Compatibility
Trading Styles
- Swing Trading
- Scalping
- Day Trading
Supported Markets
- Forex
- Cryptocurrencies
- Equities (Stocks)
- Commodities
- Indices
Detected Pattern Types
The indicator organizes market patterns into two primary categories:
Bullish Patterns
- DBLHC (Double Bar Low Higher Close)
- Indicates the possibility of upward price movement
- TMLTB (Two Matching Low Bars)
- Confirms support levels and suggests bullish continuation
- Bullish Pin Bar
- Signals a potential shift from bearish to bullish conditions
- BUOVB (Bullish Outside Vertical Bar)
- Reflects strong continuation within an uptrend
Bearish Patterns
- DBHLC (Double Bar High Lower Close)
- Suggests potential downward price movement
- TMHTB (Two Matching High Bars)
- Validates resistance zones and possible reversal
- Bearish Pin Bar
- Indicates a likely price decline following upward movement
- BEOVB (Bearish Outside Vertical Bar)
- Demonstrates strong continuation of bearish momentum
Neutral Pattern
- IB4 (Inside Bar 4)
- Represents consolidation phases and reduced market volatility
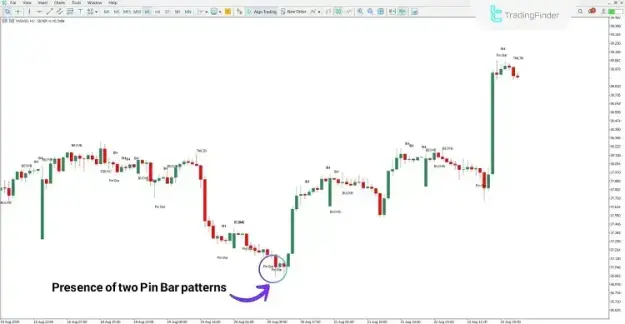
Uptrend Scenario and Buy Signal
In a sample analysis based on the XAG/USD (Silver vs. US Dollar) 1-hour timeframe:
- Two consecutive Pin Bar formations appear within a narrow price range
- This repetition strengthens the probability of a bullish reversal
- Following the pattern formation, the market moves upward with strong momentum
Key Insight:
Repeated bullish signals within a confined zone typically confirm trend reversal conditions and highlight optimal buy entry opportunities.
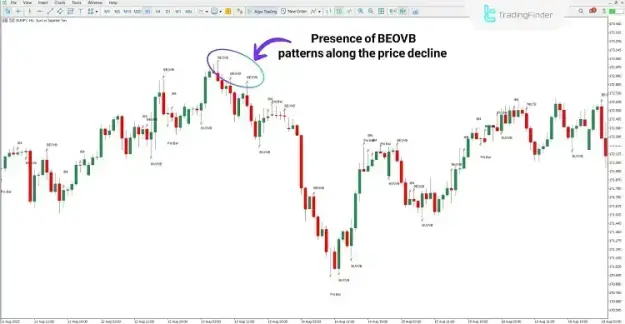
Downtrend Scenario and Sell Signal
In the EUR/JPY chart evaluation:
- The BEOVB pattern occurs multiple times at higher price levels
- This recurrence indicates persistent selling pressure
- The pattern formation confirms the start of a downward trend
Key Insight:
Multiple bearish signals near resistance areas increase the reliability of sell positions.
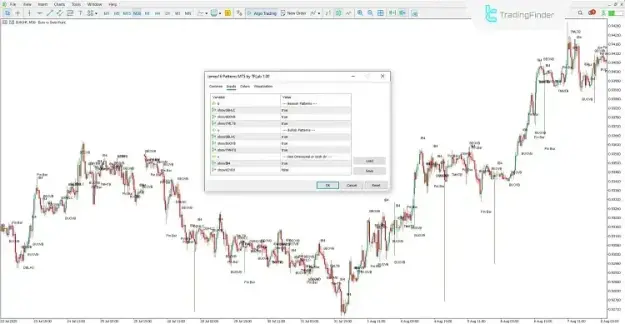
Indicator Settings
The James16 Patterns Indicator offers configurable parameters that allow traders to control which patterns are displayed:
Bearish Pattern Settings
- showDBHLC – Enables Double Bar High Lower Close
- showBEOVB – Enables Bearish Outside Vertical Bar
- showTMLTB – Enables Two Matching Low Bars
Bullish Pattern Settings
- showDBLHC – Enables Double Bar Low Higher Close
- showBUOVB – Enables Bullish Outside Vertical Bar
- showTMHTB – Enables Two Matching High Bars
Neutral / Both Directions
- showIB4 – Enables Inside Bar 4
- showKEYRV – Enables Key Reversal Patterns
Conclusion
The James16 Patterns Indicator is a robust analytical tool for traders who depend on Price Action methodologies. By automatically identifying and displaying essential candlestick patterns, it simplifies the process of recognizing trend reversals and continuations.
With its clear visual signals, structured pattern categorization, and flexible customization features, this indicator enhances trading accuracy and supports informed decision-making across various markets and timeframes.