Through adaptive color changes, the indicator allows traders to quickly identify trend shifts directly on the chart. Moreover, the indicator line serves as an important technical level, often acting as a zone for price reactions, pullbacks, and retests.
https://cdn.tradingfinder.com/file/5...5-by-tflab.zip
https://www.metalsmine.com/thread/13...load-freetflab
https://www.forexfactory.com/thread/...-in-metatrader
Prop Firm DrawDown Protector : Prop Firm Capital Protection Expert MT5 |Forex Money Management: Forex Trade Management Expert MT5 | ICT Concepts Indicator MT5 |Smart Money Concepts Expert MT5 | Smart Money Trap Scanner | Get a free Expert Advisor license via Telegram and WhatsApp
Pretty T3 Indicator Specifications
The key features and classification of the Pretty T3 Indicator include:
- Indicator Categories:
- Signal & Forecast Indicators
- Volatility Indicators
- Support and Resistance Levels
- Platform:
- MetaTrader 5
- User Level:
- Beginner to Intermediate
- Indicator Classification:
- Reversal Indicator
- Timeframe:
- Multi-Timeframe
- Trading Methods:
- Swing Trading
- Scalping
- Day Trading
- Supported Assets:
- Forex
- Cryptocurrencies
- Stocks
- Commodities
- Indices
Pretty T3 Indicator Overview
The Pretty T3 Indicator is calculated using the Typical Price, which is derived from the average of the High, Low, and Close values of each candlestick. This calculation method enhances smoothing and reduces the effect of market fluctuations.
The indicator represents market conditions through a color-based system:
- Blue Line: Indicates bullish conditions
- Red Line: Indicates bearish conditions
These visual elements help traders identify trend direction and potential reversal areas efficiently.
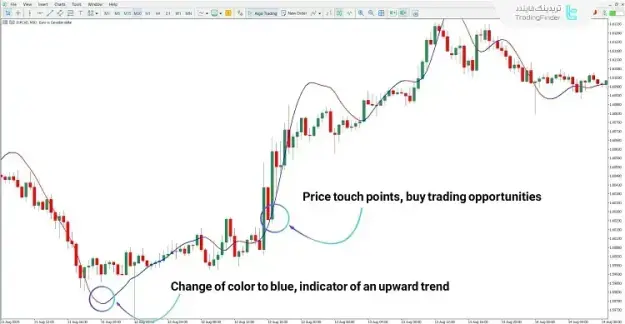
Bullish Trend Analysis
In bullish market conditions, a change in the indicator line from red to blue signals the possible start of an upward trend.
Important points in bullish analysis include:
- The color shift serves as an early indication of trend reversal
- Price corrections toward the indicator line can present buying opportunities
- The indicator line acts as dynamic support during the uptrend
These conditions provide a structured framework for entering buy trades in alignment with market direction.
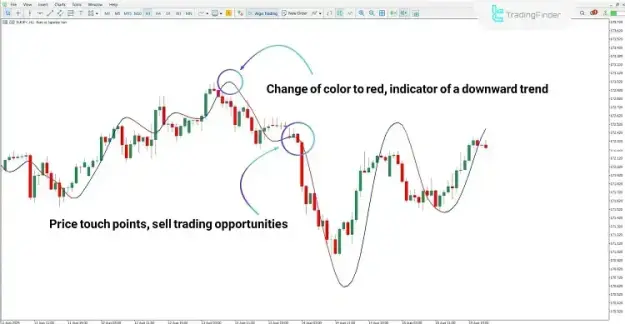
Bearish Trend Analysis
In bearish market scenarios, a transition from blue to red indicates the beginning of a downward trend.
Key aspects of bearish analysis include:
- The color change confirms a shift toward bearish market conditions
- Price pullbacks to the indicator line can offer selling opportunities
- The indicator line functions as dynamic resistance
This structure helps traders identify suitable conditions for entering sell positions based on trend direction.
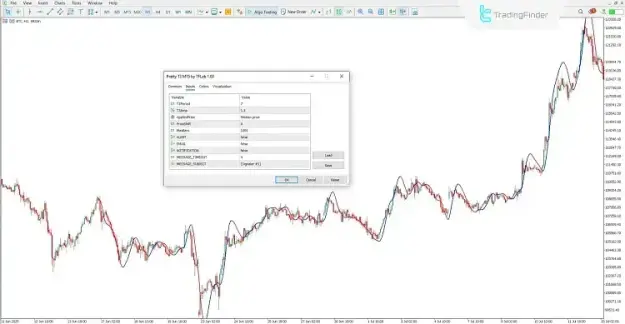
Pretty T3 Indicator Settings
The Pretty T3 Indicator includes several adjustable parameters to tailor its performance:
- T3Period: Determines the calculation period
- T3Amp: Controls the smoothing factor
- AppliedPrice: Specifies the price type used
- PriceShift: Adjusts the position of the indicator line
- MaxBars: Sets the number of candles used in calculations
- RGBMode: Enables color-changing functionality
- ALERT: Activates alert notifications
- EMAIL: Sends alerts via email
- NOTIFICATION: Enables push alerts
- MESSAGE_TIMEOUT: Defines the delay between alerts
- MESSAGE_SUBJECT: Sets the alert title
Conclusion
The Pretty T3 Indicator utilizes a smoothed moving average approach to display market trends in a clear and structured manner. Its color-based signaling system simplifies the identification of both trend reversals and continuation patterns.
In addition to generating trading signals, the indicator also acts as a dynamic support and resistance level. Price interactions with this level are important for technical analysis, making the Pretty T3 Indicator a valuable tool for traders seeking more accurate and informed trading decisions.