By combining a momentum-based histogram with an oscillator line, this indicator allows traders to analyze market direction with precision and optimize entry points for higher-probability trades.
https://cdn.tradingfinder.com/file/5...5-by-tflab.zip
https://www.metalsmine.com/thread/13...mt4-free-tflab
https://www.forexfactory.com/thread/...-in-metatrader
Prop Firm DrawDown Protector : Prop Firm Capital Protection Expert MT5 |Forex Money Management: Forex Trade Management Expert MT5 | ICT Concepts Indicator MT5 |Smart Money Concepts Expert MT5 | Smart Money Trap Scanner | Get a free Expert Advisor license via Telegram and WhatsApp
Key Features and Specifications
- Category: Oscillator and Trading Assistance Tool
- Indicator Type: Trend-following and Lagging
- Timeframe: Multi-Timeframe compatible
- Trading Styles:
- Intraday Trading
- Scalping
- Day Trading
- Supported Markets:
- Forex
- Cryptocurrencies
- Stocks
- Indices
Indicator Structure and Signal Logic
The FTLM STLM Histogram Indicator visualizes momentum using colored histogram bars and an oscillator line:
- Green Histogram and Line: Signifies bullish momentum and upward price pressure
- Red Histogram and Line: Signifies bearish momentum and downward price pressure
Signal Interpretation
- A transition from red to green indicates that a bearish correction has ended and a bullish trend is emerging or continuing
- A transition from green to red shows that a bullish correction has finished and a bearish trend is resuming
These color transitions act as confirmation signals, helping traders align with the dominant trend and avoid counter-trend entries.
Trading Applications
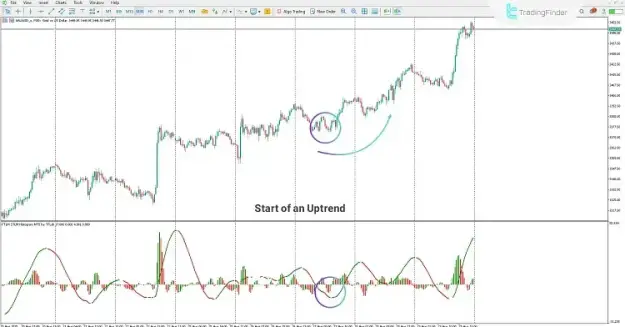
Bullish Trend Scenario
During an uptrend, the indicator assists in identifying the end of temporary pullbacks and the continuation of upward momentum:
- Histogram shifts from red to green
- Oscillator confirms rising bullish pressure
- Traders can consider entering buy trades aligned with the main trend
This method allows for more strategic trade entries following short-term retracements.
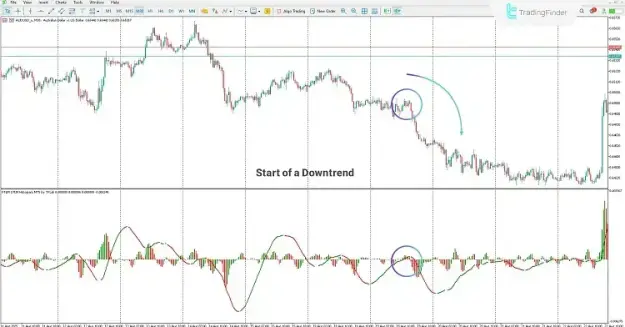
Bearish Trend Scenario
In a downtrend, the indicator helps detect the end of corrective upward movements:
- Histogram changes from green to red
- Oscillator confirms growing bearish pressure
- Traders may look for sell positions in line with the dominant trend
The size of the histogram bars provides additional insight into the strength and momentum of the current trend.
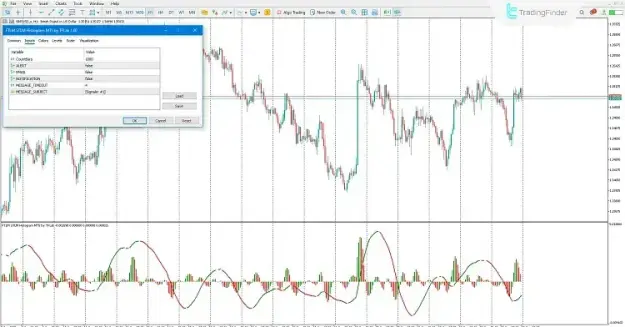
Indicator Settings
The FTLM STLM Histogram Indicator offers configurable options for better usability and adaptability:
- Count Bars: Sets the number of candles displayed on the histogram
- Alert System:
- Enable or disable visual alerts
- Receive email notifications on trend changes
- Mobile push notifications for real-time updates
- Message Timeout: Determines the interval between consecutive alerts
- Message Subject: Allows customization of alert messages for easier identification
These settings allow traders to adapt the indicator to their trading style and strategy requirements.
Conclusion
The FTLM STLM Histogram Indicator is a reliable and efficient momentum analysis tool for the MetaTrader 5 environment. It provides clear visualization of trend direction and strength while signaling the end of corrective phases.
By utilizing the histogram color transitions and oscillator confirmations, traders can enhance trade timing, improve decision-making, and maintain positions aligned with the main market trend, making this indicator a valuable component of any systematic trading strategy.