Through color variations, the indicator highlights transitions between bullish and bearish market conditions. These visual signals allow traders to detect when the market is leaving a corrective phase and potentially returning to its dominant trend.
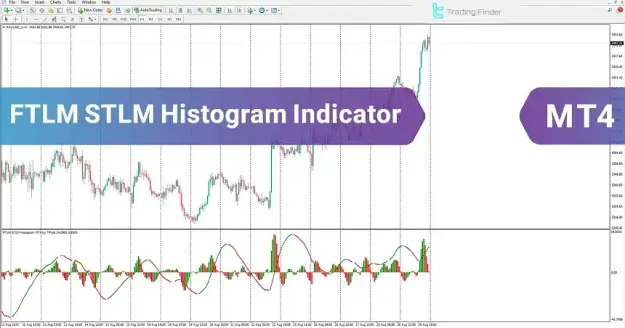
The FTLM STLM Histogram Indicator is designed to operate on the MetaTrader 4 (MT4) trading platform.
https://cdn.tradingfinder.com/file/5...4-by-tflab.zip
https://www.metalsmine.com/thread/13...mt-5-freetflab
https://www.forexfactory.com/thread/...-in-metatrader
Prop Firm DrawDown Protector : Prop Firm Capital Protection Expert MT4 | Forex Money Management: Forex Trade Management Expert MT4 |ICT Concepts Indicator MT4 | Smart Money Concepts Expert MT4| Smart Money Trap Scanner | Get a free Expert Advisor license via Telegram and WhatsApp
FTLM STLM Histogram Indicator Specifications
The main characteristics of the FTLM STLM Histogram Indicator are outlined below.
Indicator Categories
- Oscillators MT4 Indicators
- Currency Strength MT4 Indicators
- Trading Assist MT4 Indicators
Platform Compatibility
- MetaTrader 4 (MT4)
Required Trading Experience
- Elementary trading skills
Indicator Classification
- Trend Indicators
- Lagging Indicators
Supported Timeframes
- Multi-timeframe capability
Suitable Trading Styles
- Day Trading
- Intraday Trading
- Scalping Strategies
Supported Trading Instruments
- Forex currency pairs
- Cryptocurrency markets
- Stock shares
- Global indices
Indicator Overview
The FTLM STLM Histogram Indicator for MT4 is designed to assist traders in identifying trend reversals as well as continuation opportunities based on the prevailing market direction.
When used alongside standard technical analysis methods, this indicator enables traders to:
- Determine the primary market trend
- Detect temporary corrective price movements
- Anticipate the continuation of the dominant trend
The indicator includes an oscillator line that changes color dynamically, reflecting variations in market sentiment and momentum.
- When the market transitions from bearish to bullish, the oscillator changes from red to green.
- When the market moves from bullish to bearish, the oscillator changes from green to red.
These color changes allow traders to quickly interpret momentum shifts and directional changes in the market.
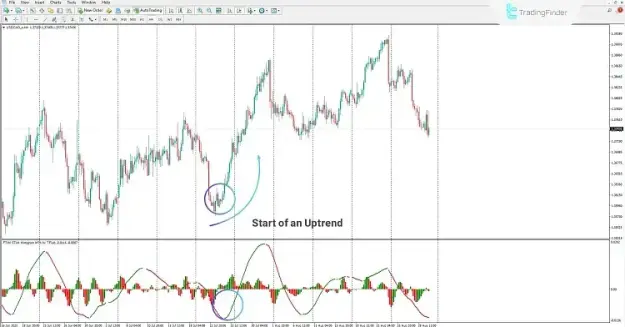
Bullish Market Scenario
In a bullish market environment, the FTLM STLM Histogram Indicator can help traders identify when a short-term correction is ending and when the upward trend may continue.
For example, when reviewing the 4-hour chart of the USDCAD currency pair, traders may notice the following conditions:
- The market remains in an overall uptrend
- Price enters a temporary correction
- The histogram and oscillator track changes in market momentum
A potential buy opportunity may arise when:
- The histogram changes color
- The oscillator line shifts from red to green
This transition may indicate that the correction has finished and the market is likely to resume its primary bullish trend.
Important analytical observations include:
- Recognition of continued bullish momentum
- Identification of momentum shifts within the histogram
- Confirmation of the transition from correction to trend continuation
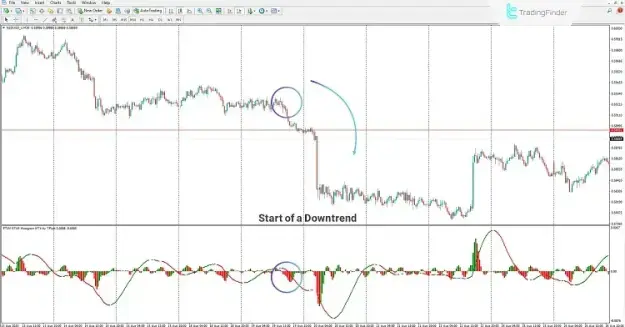
Bearish Market Scenario
Within a bearish market trend, the FTLM STLM Histogram Indicator can help traders recognize when a corrective upward movement ends and the downward trend resumes.
For instance, when analyzing the 30-minute chart of the NZDUSD pair, traders may observe:
- The overall market direction is bearish
- Price experiences a temporary upward correction
- The oscillator line tracks changes in market momentum
A potential sell signal may occur when:
- The oscillator line changes from green to red
This shift may suggest that the correction has ended and the market may continue moving in the dominant bearish direction.
Key analytical signals include:
- Confirmation of bearish trend continuation
- Detection of momentum reversal following a correction
- Identification of possible selling opportunities
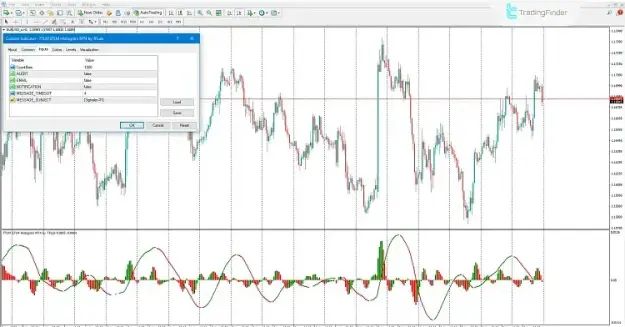
FTLM STLM Histogram Indicator Settings
The indicator provides several configurable parameters that allow traders to adjust its behavior according to their trading strategy and preferences.
Key settings include:
Count Bars
- Determines the maximum number of candles displayed in the histogram window.
ALERT
- Enables or disables alerts when the oscillator detects a trend change.
- Allows the indicator to send signal notifications via email.
NOTIFICATION
- Activates push notifications for mobile devices when the trend direction changes.
MESSAGE_TIMEOUT
- Specifies the interval between alert messages.
MESSAGE_SUBJECT
- Allows traders to customize the subject of alert messages.
These options enable traders to incorporate the indicator into automated alert systems and organized trading processes.
Conclusion
The FTLM STLM Histogram Indicator for MT4 is a practical technical analysis tool that helps traders detect changes in trend momentum and potential market reversal points.
By presenting information through a histogram display and a color-changing oscillator line, the indicator provides clear visual signals that illustrate transitions between corrective movements and the dominant market trend.
Key advantages of this indicator include:
- Visual detection of trend reversals
- Identification of corrective market phases
- Confirmation of trend continuation signals
- Compatibility with different trading strategies and financial markets
When the oscillator changes from red to green, it indicates a transition from bearish conditions to bullish momentum. Conversely, when the oscillator switches from green to red, it may signal the beginning of a bearish reversal.
These features make the FTLM STLM Histogram Indicator a useful addition to a trader’s technical analysis toolkit on the MetaTrader 4 platform.