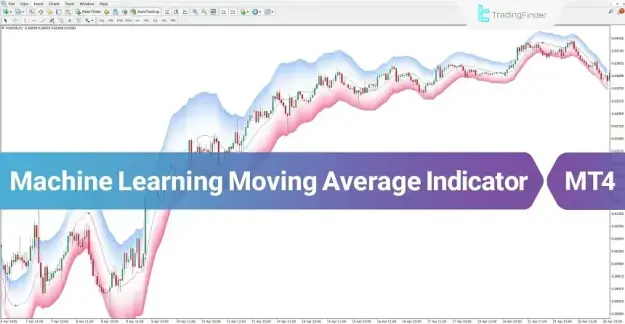
By reducing the impact of short-term price fluctuations and market noise, the indicator reveals the core trend structure of the market. This capability enables traders to interpret price movements with greater clarity and recognize potential trading opportunities more accurately.
In addition to the primary moving average line, the indicator displays upper and lower bands that outline the expected range of price movement. These bands serve as dynamic boundaries that help traders detect breakout points, anticipate possible reversals, and evaluate momentum changes within the market.
https://cdn.tradingfinder.com/file/5...4-by-tflab.zip
https://www.metalsmine.com/thread/13...cator-mt5-free
https://www.forexfactory.com/thread/...-in-metatrader
Prop Firm DrawDown Protector : Prop Firm Capital Protection Expert MT4 | Forex Money Management: Forex Trade Management Expert MT4 |ICT Concepts Indicator MT4 | Smart Money Concepts Expert MT4| Smart Money Trap Scanner | Get a free Expert Advisor license via Telegram and WhatsApp
Specification of the Machine Learning Moving Average Indicator
The Machine Learning Moving Average MT4 indicator includes several key features and specifications:
Indicator Categories
- Signal & Forecast MT4 Indicators
- Machine Learning Indicators for MetaTrader 4
- Moving Average MT4 Indicators
Platform
- MetaTrader 4 (MT4)
Trading Experience Level
- Suitable for traders with basic or elementary trading knowledge
Indicator Type
- Trend and reversal identification indicator
Supported Timeframes
- Multi-Timeframe functionality
Trading Styles
- Day Trading
- Scalping
- Swing Trading
Supported Trading Markets
- Forex currency pairs
- Cryptocurrencies
- Stock market instruments
- Indices markets
- Commodity markets
- Share stocks
Machine Learning Moving Average Indicator Overview
The Machine Learning MA Indicator generates trading signals by evaluating the interaction between price movement and the indicator’s dynamic bands.
The location of price relative to the upper and lower bands plays an essential role in determining possible market direction. When the price moves beyond these boundaries, it often indicates a shift in market momentum and may signal the beginning of a new directional move.
The main signal concepts include:
- Bullish Signal
- Triggered when the price breaks above the upper band.
- Bearish Signal
- Triggered when the price falls below the lower band.
This analytical framework helps traders identify potential trend continuation setups as well as possible reversal points.
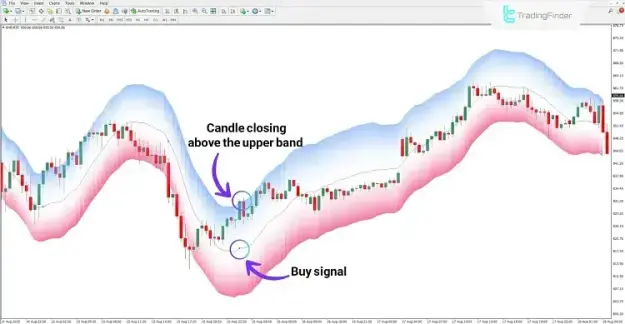
Buy Signal
A buy signal is generated when the price breaks above the upper band and the candle successfully closes outside this level.
For example, on the Binance Coin (BNB) chart within the 30-minute timeframe, the price moves above the upper band and confirms the breakout with a completed candle close. The indicator then highlights this event with a blue marker, indicating a potential bullish trading signal.
Such a signal reflects increasing buying activity and may suggest the continuation of upward price momentum.
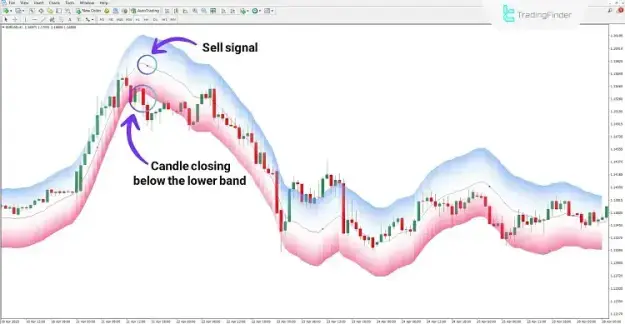
Sell Signal
A sell signal appears when the price moves below the lower band, signaling potential bearish momentum.
For instance, on the EUR/USD chart in the 1-hour timeframe, the price falls beneath the lower band. The indicator recognizes this downward breakout and marks the signal with a red marker, confirming a potential sell opportunity.
This situation typically indicates rising selling pressure and the possibility of further downward price movement.
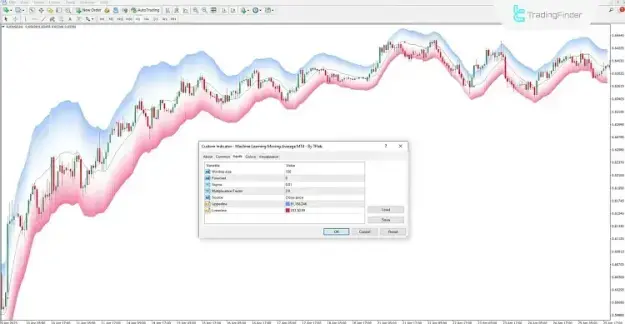
Machine Learning Moving Average Indicator Settings
The indicator includes several customizable parameters that allow traders to adjust its responsiveness and analytical performance according to their trading strategies.
Important configurable settings include:
- Window Size
- Defines the number of data points used to calculate the moving average.
- Forecast
- Determines the level of prediction and the responsiveness of the indicator.
- Sigma
- Controls the smoothing level or statistical deviation applied to the calculations.
- Multiplicative Factor
- Adjusts the expansion coefficient of the indicator bands.
- Source
- Specifies the input data used in the calculations, such as closing price or other price values.
- Upperline
- Represents the upper boundary of the projected price movement range.
- Lowerline
- Indicates the lower boundary of the expected price fluctuation range.
- Indicates the lower boundary of the expected price fluctuation range.
Conclusion
The Machine Learning Moving Average Indicator for MT4 is a valuable analytical solution for traders seeking to identify market trends while minimizing the effects of short-term volatility.
By combining statistical analysis with machine learning techniques, this indicator provides a clearer representation of market direction and enhances the reliability of trading signals.
Through the use of dynamic upper and lower bands, traders can estimate potential price ranges, detect breakout opportunities, and identify possible reversal zones. As a result, the indicator serves as a versatile tool for traders operating across multiple financial markets and trading styles.