This solution is particularly effective for traders who require precise, rule-based trendline analysis without manual chart drawing.
https://cdn.tradingfinder.com/file/5...4-by-tflab.zip
https://www.metalsmine.com/thread/13...oad-free-tflab
https://www.forexfactory.com/thread/...-in-metatrader
Prop Firm DrawDown Protector : Prop Firm Capital Protection Expert MT4 | Forex Money Management: Forex Trade Management Expert MT4 |ICT Concepts Indicator MT4 | Smart Money Concepts Expert MT4| Smart Money Trap Scanner | Get a free Expert Advisor license via Telegram and WhatsApp
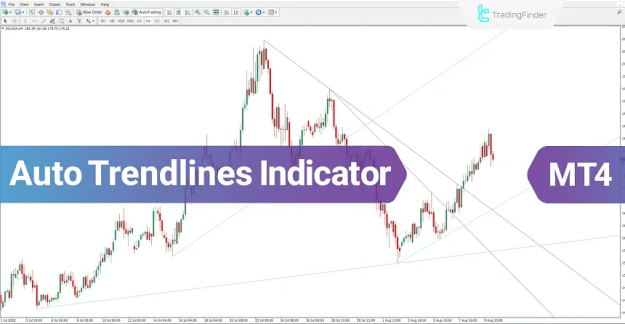
Auto TrendLines Indicator Functionality
The Auto TrendLines Indicator continuously processes price data to identify pivot points and construct adaptive trendlines. These trendlines automatically adjust to current market conditions, offering a clear and structured representation of both bullish and bearish price movements.
Primary benefits include:
- Automatic detection of market trends
- Dynamic visualization of support and resistance zones
- Identification of breakout and potential trend reversal setups
- Compatibility with a wide range of financial instruments
Indicator Classification
The Auto TrendLines Indicator is categorized within multiple areas of technical analysis, including:
- Support and Resistance Indicators for MT4
- Signal and Forecast Analysis Tools
- Price Level Identification Indicators
Supported Trading Platform
This indicator is exclusively designed for use on:
- MetaTrader 4 (MT4)
Trader Experience Level
The Auto TrendLines Indicator is suitable for:
- Beginner and early-stage traders
- Traders seeking automated trendline solutions
Indicator Purpose
This indicator operates as:
- A breakout detection tool
- A trend reversal confirmation indicator
Timeframe Compatibility
The Auto TrendLines Indicator functions as a:
- Multi-timeframe MT4 indicator
It can be applied to all chart timeframes, ranging from short-term intraday charts to long-term market analysis.
Supported Trading Styles
The indicator supports multiple trading approaches, including:
- Day trading
- Scalping techniques
- Swing trading strategies
Supported Asset Classes
The Auto TrendLines Indicator can be applied across various financial markets, such as:
- Forex currency pairs
- Cryptocurrency markets
- Commodity instruments
- Stocks and equities
- Global market indices
Trend Visualization Method
Trend direction is displayed using color-based trendlines:
- Green trendlines indicate bullish trends and function as support
- Red trendlines represent bearish trends and act as resistance
When price interacts with these trendlines through retracements or breakouts, the indicator automatically generates trading signals in alignment with the dominant trend.
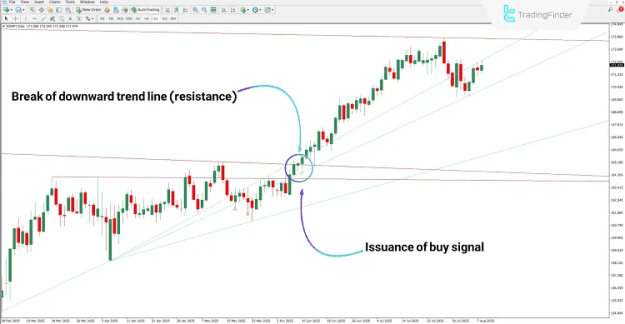
Buy Signal Conditions
A buy signal is triggered when price breaks above a descending trendline.
Example scenario:
- On the EUR/JPY daily chart, price moves above the downward trendline
- The indicator confirms the breakout
- A green arrow appears, indicating a potential long position
This signal may indicate either bullish trend continuation or a market trend reversal.
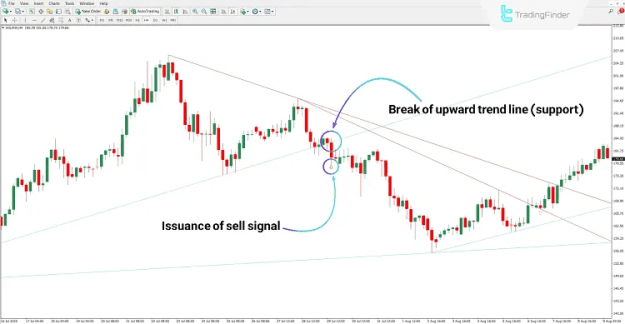
Sell Signal Conditions
A sell signal is generated when price breaks below an ascending trendline.
Example scenario:
- On the 4-hour Solana (SOL) chart
- Price falls below the upward support trendline
- A red arrow appears, signaling a possible sell opportunity
This movement suggests increasing bearish momentum or potential downside continuation.
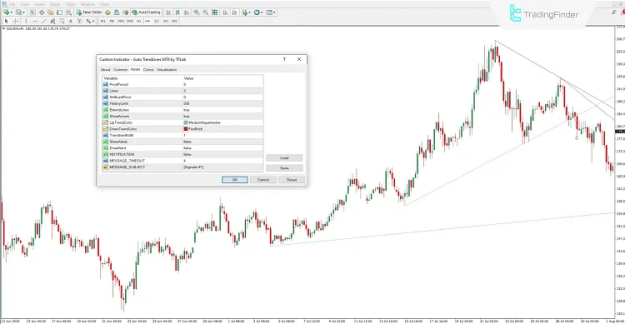
Auto TrendLines Indicator Configuration
The indicator includes a wide range of adjustable settings, enabling traders to tailor its behavior to their trading strategies.
Key configuration options include:
- Pivot period for identifying market swings
- Number of trendlines displayed
- Adjustment of the most recent pivot location
- Historical price analysis range
- Extension of trendlines across the chart
- Visibility control for signal arrows
- Custom colors for bullish and bearish trendlines
- Trendline width adjustment
- On-chart alert activation
- Email alert notifications
- Push notifications to the trading platform or device
- Alert message display duration
- Custom alert message titles
Conclusion
The Auto TrendLines Indicator is a powerful and reliable tool for traders who utilize trendline-based technical analysis. By automatically generating uptrend and downtrend lines through pivot point calculations, it removes subjective interpretation and improves analytical consistency.
With accurate identification of key support and resistance levels, combined with timely breakout and retracement signals, the Auto TrendLines Indicator enables traders to make informed trading decisions across multiple markets and timeframes.