https://cdn.tradingfinder.com/file/5...4-by-tflab.zip
https://www.metalsmine.com/thread/13...mt5-free-tflab
https://www.forexfactory.com/thread/...-in-metatrader
Prop Firm DrawDown Protector : Prop Firm Capital Protection Expert MT4 | Forex Money Management: Forex Trade Management Expert MT4 |ICT Concepts Indicator MT4 | Smart Money Concepts Expert MT4| Smart Money Trap Scanner | Get a free Expert Advisor license via Telegram and WhatsApp
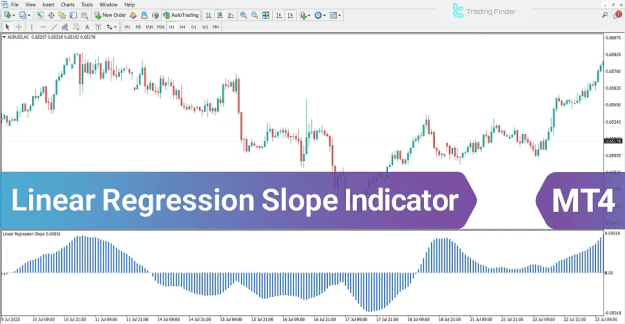
The histogram provides a clear visual representation of market momentum:
- Longer histogram bars reflect strong directional movement and increasing momentum.
- Shorter histogram bars indicate weakening momentum or potential market consolidation.
Linear Regression Slope Indicator Overview
The Linear Regression Slope Indicator for MetaTrader 4 (MT4) is widely used across multiple financial markets, including Forex, cryptocurrencies, commodities, indices, and equities, to identify trend reversals, breakout zones, and momentum transitions.
Unlike traditional trend-following indicators, this tool focuses on price velocity, making it highly effective for detecting early shifts in market behavior before a trend becomes fully established.
Indicator Classification and Application Scope
Indicator Categories
- Oscillators MT4 Indicators
- Trading Assist MT4 Indicators
- Momentum Indicators for MT4
Platform Compatibility
- MetaTrader 4 (MT4)
Skill Level
- Intermediate
Indicator Function
- Momentum and Reversal Detection
Timeframe Support
- Multi-Timeframe Analysis
Trading Style
- Intraday Trading
Supported Trading Instruments
- Forex Market
- Cryptocurrency Market
- Commodity Market
- Indices Market
- Share Stocks
- Stock Market
Linear Regression Slope Indicator at a Glance
The Linear Regression Slope Indicator helps traders locate critical reversal areas and breakout levels by analyzing the structural behavior of price. The indicator is built around three essential reference points that guide trade decisions:
- Point 1
Represents the start of the primary price wave and forms at a major swing high or swing low. - Point 2
Marks the end of the first corrective phase and signals the initial change in price direction. - Point 3
Identifies the second corrective movement, where trend continuation or reversal may occur.
A key advantage of the Linear Regression Slope Indicator compared to the ZigZag indicator is its ability to define a Trigger Point, where a confirmed breakout beyond Point 2 can indicate a significant shift in market momentum.
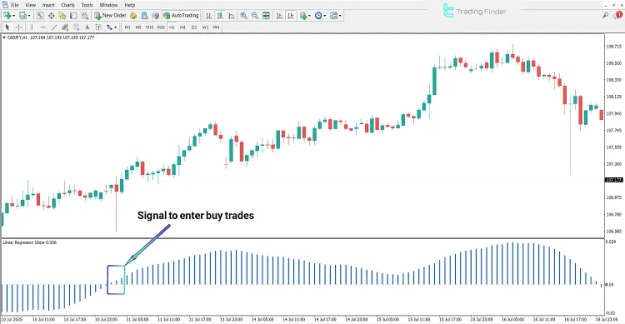
Linear Regression Slope Indicator in an Uptrend
The CAD/JPY currency pair on the 1-hour timeframe illustrates bullish conditions identified by the Linear Regression Slope Indicator.
Uptrend Structure Explanation
- Point 1 forms at a recent market low and signals the beginning of an upward move.
- Point 2 develops at the peak of the first corrective phase and acts as short-term resistance.
- Point 3 appears as a pullback that remains above Point 1, indicating reduced selling pressure and strong buyer dominance.
A buy entry signal is confirmed when a bullish candle closes near Point 3, increasing the likelihood of continued upward movement.
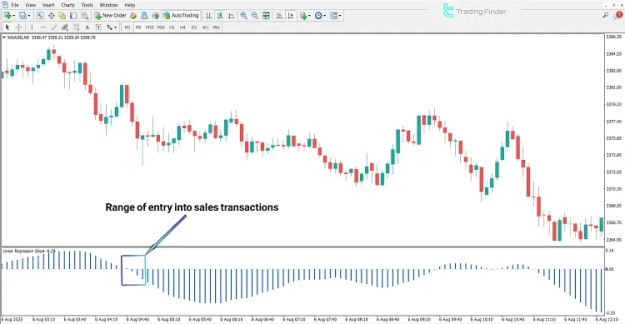
Linear Regression Slope Indicator in a Downtrend
The XAU/USD (Gold) example on the 5-minute timeframe demonstrates bearish market conditions detected by the indicator.
When the linear regression slope crosses below zero and continues declining, it reflects increasing selling pressure and accelerating downside momentum.
Downtrend Signal Characteristics
- A break below the zero level suggests the potential start of a downtrend.
- Continued movement deeper into the negative zone confirms bearish strength.
- Signal reliability improves when combined with:
- Bearish candlestick patterns
- Increased trading volume
A sell signal is generated when price action aligns with a declining slope structure.
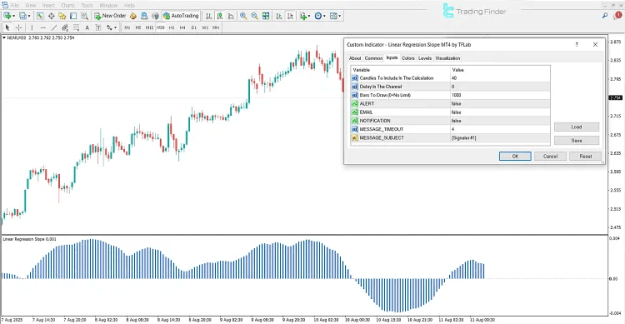
Linear Regression Slope Indicator Settings in MT4
The indicator provides configurable inputs to adapt to various trading strategies and market conditions.
Adjustable Input Parameters
- Candles To Include In The Calculation
Defines the number of candles used to calculate the regression slope. - Delay In The Channel
Applies a smoothing delay to the indicator output. - Bars To Draw (0 = No Limit)
Determines how many histogram bars are displayed. - ALERT
Activates on-screen alerts when signal conditions are met. - EMAIL
Sends email notifications for trading signals. - NOTIFICATION
Enables push notifications on the trading platform. - MESSAGE_TIMEOUT
Sets the duration of alert messages. - MESSAGE_SUBJECT
Customizes the alert notification title.
Conclusion
The Linear Regression Slope Indicator evaluates market momentum by calculating the slope of a regression line over a specified period, allowing traders to clearly identify trend direction and strength.
- Histogram bars above zero indicate bullish momentum.
- Histogram bars below zero signal bearish momentum.
- Increasing bar length reflects strengthening trends, while decreasing bar length suggests momentum exhaustion.
By combining statistical precision with clear visual interpretation, the Linear Regression Slope Indicator remains a powerful analytical tool for traders seeking momentum confirmation, trend validation, and early reversal detection within the MetaTrader 4 trading environment.