- Primary Function: Detection of trend reversal and breakout levels.
- Core Methodology: Identification of three consecutive significant price points (1, 2, and 3).
- Key Advantage: Provides specific entry triggers, enhancing the basic 1-2-3 pattern strategy.
![]() You can download it from this link:
You can download it from this link:
https://cdn.tradingfinder.com/file/6...5-by-tflab.zip
![]() You can also access the MetaTrader 4 version of this Indicator through this page:
You can also access the MetaTrader 4 version of this Indicator through this page:
https://www.metalsmine.com/thread/13...r-mt4-download
![]() For instructions on how to install:
For instructions on how to install:
https://www.forexfactory.com/thread/...-in-metatrader
Prop Firm DrawDown Protector : Prop Firm Capital Protection Expert MT5 |Forex Money Management: Forex Trade Management Expert MT5 | ICT Concepts Indicator MT5 |Smart Money Concepts Expert MT5 | Smart Money Trap Scanner | Get a free Expert Advisor license via Telegram and WhatsApp
Indicator Classification & Compatibility
This versatile indicator is designed for the MetaTrader 5 platform and caters to intermediate-level traders seeking to enhance their technical analysis.
- Platform: MetaTrader 5 (MT5)
- Trading Skill Level: Intermediate
- Timeframe: Multi-Timeframe Analysis
- Trading Style: Ideal for Intraday Trading
- Indicator Types: Encompasses Reversal, Signal & Forecast, Trading Assist, and Chart & Classic categories.
- Markets: Effective across Forex, Cryptocurrency, and Stock indices.
How the Show 123 Pattern Indicator Works
The tool scans price action to define three critical pivot points that form the foundation of a potential new trend or continuation.
- Point 1: This marks the start of the main wave. It is a recent significant high in a developing downtrend or a significant low in a developing uptrend.
- Point 2: This represents the end of the first corrective wave against the initial move from Point 1. It acts as a temporary resistance (in uptrends) or support (in downtrends).
- Point 3: This point forms after the price corrects again from Point 2. Crucially, in a valid pattern, Point 3 will be a higher low (in an uptrend) or a lower high (in a downtrend) compared to Point 1. The price action at this point indicates weakening momentum against the nascent trend.
The indicator’s unique value lies in its precise identification of the Trigger Point—the breakout above or below the level at Point 2—which signals a confirmed shift in market momentum and provides the trade entry signal.
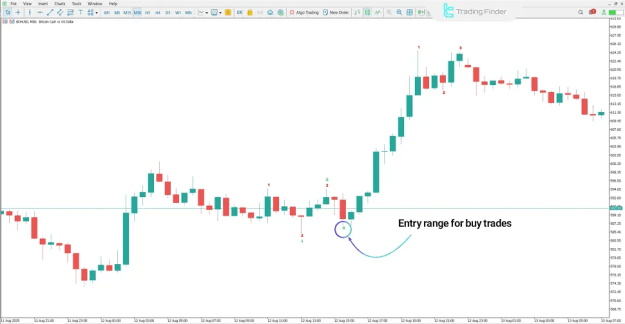
Trading an Uptrend with the Indicator
In a bullish scenario, the indicator identifies and marks three consecutive points in green.
- Point 1: A significant market low, initiating upward movement.
- Point 2: The peak of the first corrective wave downward, establishing resistance.
- Point 3: A second, higher low, indicating sustained buying pressure and weak selling interest.
Entry Signal: A buy signal is generated when the price completes the pattern at Point 3 and then a bullish candle closes above the level of Point 2, confirming the breakout and continuation of the upward trend.
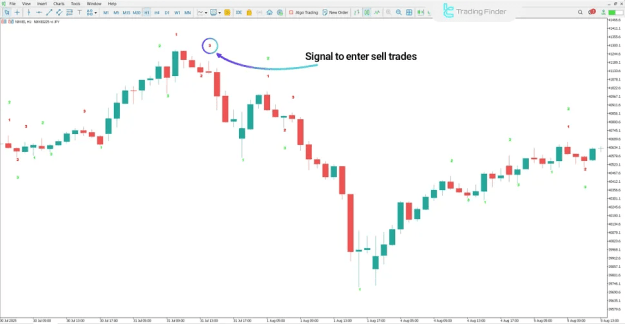
Trading a Downtrend with the Indicator
In a bearish scenario, the indicator plots the three points to define a descending structure.
- Point 1: A significant market high, starting the downward move.
- Point 2: The low of the first corrective wave upward, acting as support.
- Point 3: A second, lower high, demonstrating persistent selling pressure and feeble buying attempts.
Entry Signal: A sell signal is issued when the price forms Point 3 and then a bearish candle closes below the level of Point 2, confirming the breakdown and resumption of the downtrend.
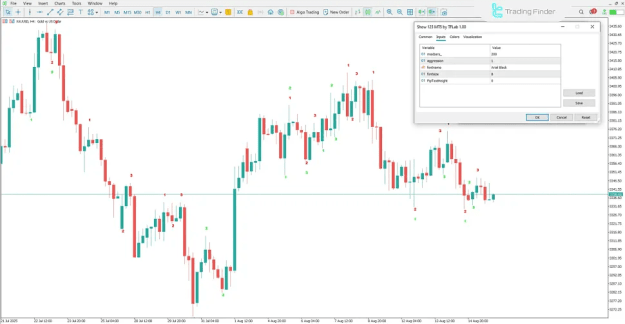
Configuring the Show 123 Pattern Indicator in MT5
Optimizing the indicator settings is crucial for aligning it with your trading instrument and style. The main parameters in the settings panel include:
- Max Bars: Defines the historical lookback period for calculation. A higher value processes more candles.
- Aggression: Controls the sensitivity for point identification. Higher aggression detects more minor swings, while lower aggression focuses on more significant pivots.
- Font Name & Font Size: Customize the appearance of the numbered labels (1, 2, 3) on the chart.
- Pip Text Height: Adjusts the display size of the price value text associated with each point.
Conclusion
The Show 123 Pattern Indicator excels by transforming the theoretical 1-2-3 pattern into a clear, visual trading system. It provides objective criteria for identifying market structure and pinpointing entry levels.
- In a confirmed uptrend, the pattern demonstrates buyer strength through a sequence of a higher low (Point 3) followed by a breakout above resistance (Point 2).
- In a confirmed downtrend, it reveals seller dominance via a lower high (Point 3) succeeded by a breakdown below support (Point 2).
By focusing on these key breakout levels, the indicator serves as an accurate tool for traders aiming to capitalize on both trend continuations and early-stage reversals across various financial markets.