https://cdn.tradingfinder.com/file/5...4-by-tflab.zip
https://www.metalsmine.com/thread/13...der-5-download
https://www.forexfactory.com/thread/...-in-metatrader
Prop Firm DrawDown Protector : Prop Firm Capital Protection Expert MT4 | Forex Money Management: Forex Trade Management Expert MT4 |ICT Concepts Indicator MT4 | Smart Money Concepts Expert MT4| Smart Money Trap Scanner | Get a free Expert Advisor license via Telegram and WhatsApp
Omega Trend Indicator: Core Specifications and Profile
The Omega Trend Indicator is a multi-faceted tool categorized under several key functional types. It is primarily recognized as a Signal & Forecast MT4 Indicator, a Trading Assist MT4 Indicator, and a Bands & Channels MT4 Indicator.
- Supported Platform: This indicator is developed exclusively for the MetaTrader 4 (MT4) platform.
- Required Trading Skill Level: Elementary. Its intuitive visual design makes it accessible for traders of all experience levels.
- Indicator Type: It functions effectively as a Reversal MT4 Indicator, helping to spot potential trend changes.
- Timeframe Compatibility: As a Multi-Timeframe MT4 Indicator, it provides reliable signals across various chart intervals.
- Trading Style Adaptability: The Omega Trend Indicator is suitable for multiple trading approaches, including Day Trading, Scalping, and Swing Trading.
- Market Application: It is a robust tool for analyzing diverse financial instruments, such as the Forex market, Cryptocurrency assets (like Solana), and the Stock Market.
Omega Trend Indicator at a Glance: Interpreting the Signals
The trading logic of the Omega Trend Indicator is visually straightforward:
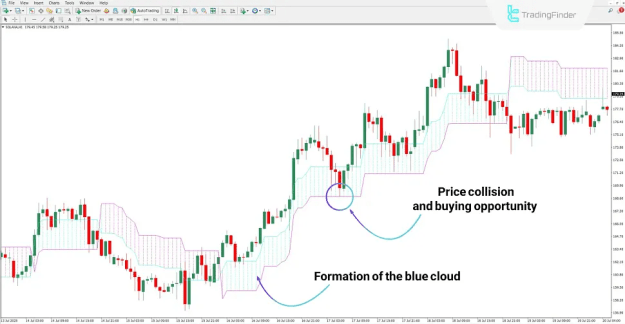
- A blue cloud or channel signifies a bullish trend condition.
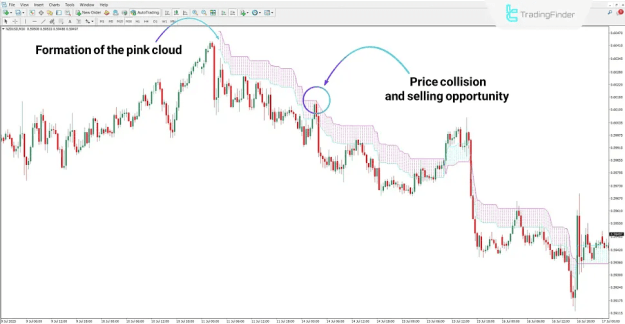
- A pink (or purple) cloud or channel signifies a bearish trend condition.
A primary trading method involves using price reactions at the boundaries of these dynamic channels as potential entry points for trades.
Identifying Bullish Market Conditions with the Omega Trend Indicator
Analyzing a Solana (SOL) cryptocurrency chart on the 1-hour timeframe, the indicator's formation of a distinct blue cloud confirms a bullish trend. Under these conditions, traders can monitor two key scenarios for long position opportunities:
- When the price touches or pulls back to the lower boundary of the blue channel.
- When the price re-enters the blue cloud area following a dip.
These interactions are considered potential setups for initiating buy trades in alignment with the upward trend.
Identifying Bearish Market Conditions with the Omega Trend Indicator
Observing the NZD/USD currency pair on a 30-minute chart, the consistent generation of a pink cloud by the Omega Trend Indicator clearly visualizes a bearish trend. As demonstrated on the chart, strategic short-selling opportunities often arise when the price rallies and touches the upper boundary of the pink dynamic channel. These touchpoints serve as high-probability zones for entering short positions to capitalize on the downward momentum.
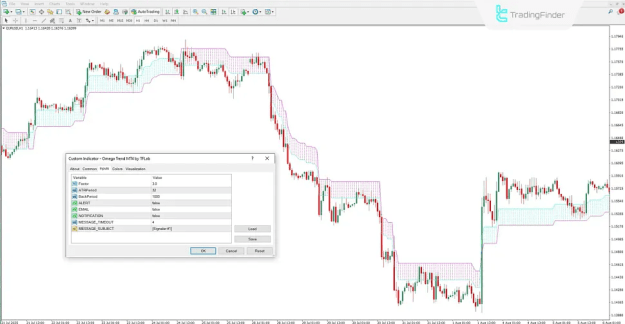
Configuring the Omega Trend Indicator: Settings Overview
The indicator's sensitivity and alert functions can be customized through its settings panel. Key adjustable parameters include:
- Factor: This numerical coefficient controls the indicator's sensitivity to price changes. Adjusting this value alters the width and responsiveness of the dynamic channel.
- ATRperiod: Defines the number of candlesticks used to calculate the Average True Range (ATR), a core component in determining market volatility and channel width.
- BackPeriod: Sets the look-back period, or the number of historical candles analyzed to establish the prevailing trend direction.
- Alert Features: The indicator includes integrated alert systems:
- ALERT: Activates pop-up alerts.
- EMAIL: Sends alert notifications via email.
- NOTIFICATION: Sends push notifications to the MT4 platform.
- MESSAGE_TIMEOUT: Sets the minimum time interval between two consecutive alert messages.
- MESSAGE_SUBJECT: Allows customization of the subject line for email alerts.
Conclusion
In summary, the Omega Trend Indicator is an efficient analytical tool that uses a clear color-coded system—blue for bullish and pink/purple for bearish trends—to filter market noise and highlight the core trend direction. By leveraging Average True Range (ATR) calculations and fully adjustable parameters, it constructs dynamic support and resistance zones. This functionality empowers traders to objectively identify potential entry points, exit points, and trend reversals across various markets and timeframes, thereby enhancing decision-making precision in their trading strategy.