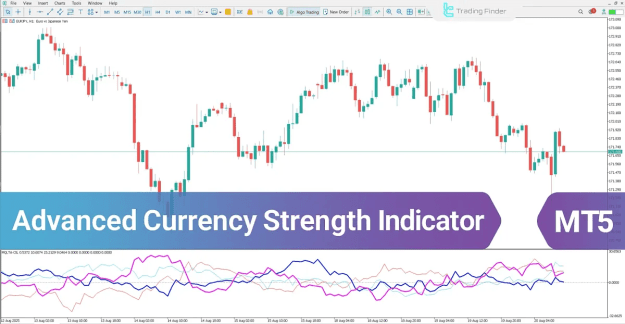
Each currency is displayed as a distinct colored line within an oscillator window. For example, USD may be shown in blue and EUR in red, allowing traders to quickly distinguish currency behavior and identify dominance in the market.
A rising line indicates increasing demand and bullish pressure, while a declining line signals weakening momentum and growing selling pressure.
https://cdn.tradingfinder.com/file/5...5-by-tflab.zip
https://www.metalsmine.com/thread/13...r-metatrader-4
https://www.forexfactory.com/thread/...-in-metatrader
Prop Firm DrawDown Protector : Prop Firm Capital Protection Expert MT5 |Forex Money Management: Forex Trade Management Expert MT5 | ICT Concepts Indicator MT5 |Smart Money Concepts Expert MT5 | Smart Money Trap Scanner | Get a free Expert Advisor license via Telegram and WhatsApp
Indicator Classification and Features
Category
- MT5 Oscillator Indicator
- Currency Strength Analysis Tool
- Trading Assistance Indicator
Platform
- MetaTrader 5
Recommended Experience Level
- Intermediate traders
Indicator Behavior
- Trend Breakout Detection
- Trend Reversal Identification
Supported Timeframes
- Multi-Timeframe
Trading Style
- Intraday Trading
Market Type
- Forex
How the Advanced Currency Strength Indicator Functions
The indicator calculates relative strength values using price data from several currency pairs and presents them in a single, consolidated oscillator panel.
Key signal interpretations include:
- Upward-moving lines → currency strength and buying dominance
- Downward-moving lines → currency weakness and selling pressure
- Line crossings → shifts in market control and potential trend changes
This structure allows traders to focus on pairing strong currencies against weak ones, improving trade selection and timing.
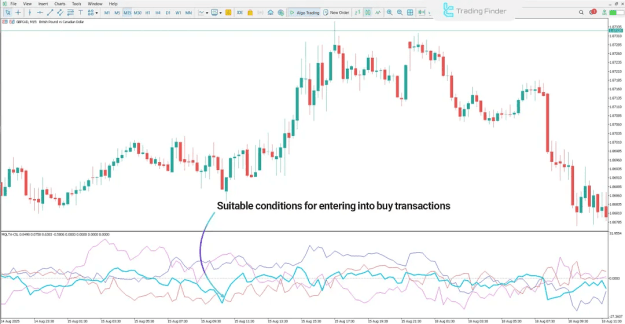
Bullish Trend Example
In a 15-minute GBP/CAD chart, a bullish condition forms when the GBP line rises above the CAD line. This movement confirms that the British Pound is gaining strength while the Canadian Dollar is losing momentum.
Such a setup indicates:
- Strong buying interest in GBP
- Reduced demand for CAD
- Favorable conditions for long positions
This alignment often marks high-probability buy opportunities.
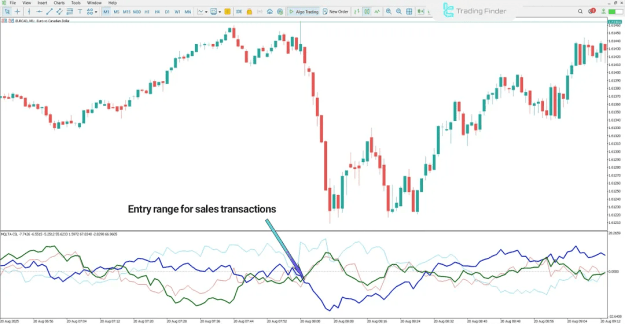
Bearish Trend Example
On a 1-minute EUR/CAD chart, a bearish scenario occurs when the EUR line falls below the CAD line. This reflects Euro weakness combined with growing strength in the Canadian Dollar.
This condition suggests:
- Increased selling pressure on EUR
- Market dominance by CAD
- Potential continuation of downward price movement
Under these circumstances, the indicator highlights sell entry zones.
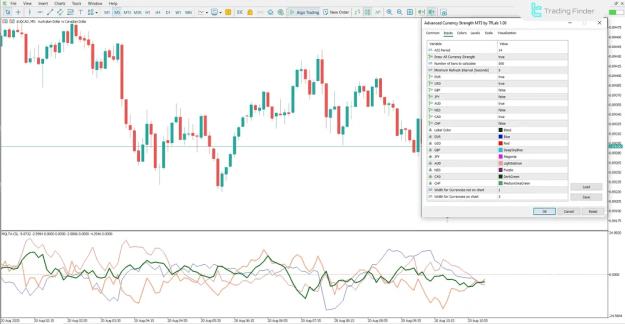
Advanced Currency Strength Indicator Settings (MT5)
The indicator offers flexible customization options:
Calculation Parameters
- RSIPeriod – RSI calculation length
- DrawAllCurrencies – Display all currencies
- MaxBars – Maximum number of analyzed candles
- MinimumRefreshInterval – Update interval control
Currency Selection
- Enable or disable individual currencies:
EUR, USD, GBP, JPY, AUD, NZD, CAD, CHF
Visual Options
- LabelColor – Currency label color
- Currency Line Colors – Individual color assignment
- NormalWidth – Default line thickness
- SelectedWidth – Highlighted line thickness
Conclusion
The Advanced Currency Strength Indicator is an effective Forex trading tool that visually illustrates currency strength and weakness using dynamic, color-coded lines.
- Rising lines indicate increasing demand
- Falling lines reveal declining strength
- Crossovers help detect momentum shifts and trend changes
By consolidating multi-currency analysis into a single oscillator, this indicator assists traders in identifying trend direction, market bias, and optimal entry points with greater confidence and efficiency.