https://cdn.tradingfinder.com/file/5...4-by-tflab.zip
https://www.metalsmine.com/thread/13...tatrader-5-mt5
https://www.forexfactory.com/thread/...-in-metatrader
Prop Firm DrawDown Protector : Prop Firm Capital Protection Expert MT4 | Forex Money Management: Forex Trade Management Expert MT4 |ICT Concepts Indicator MT4 | Smart Money Concepts Expert MT4| Smart Money Trap Scanner | Get a free Expert Advisor license via Telegram and WhatsApp
Knoxville Divergence Detection Indicator: Specifications Overview
This advanced indicator is designed for clarity and actionable signal generation on the MetaTrader 4 platform.
Indicator Classification
- Primary Category: Signal & Forecast Indicators
- Secondary Categories: Trading Assistant Indicators, Momentum Indicators
- Signal Type: Reversal Indicators
- Timeframe Compatibility: Multi-Timeframe Analysis
- Trading Style Applicability: Day Trading, Scalping, Swing Trading
- Market Compatibility: Forex, Cryptocurrency, Stock Markets
- Platform: MetaTrader 4 (MT4)
- Recommended Skill Level: Intermediate
Knoxville Divergence Detection Indicator: Core Functionality and Signal Interpretation
The Knoxville Divergence Indicator algorithmically scans for discrepancies between price movement and momentum, plotting clear visual cues directly onto the price chart. These cues are presented as distinct colored lines, simplifying the process of identifying potential reversal zones.
Signal Line Definitions:
- Green Line (Positive/Bullish Divergence): This line appears below the price candles. It signals a scenario where the price is making lower lows, but the underlying momentum (as measured by RSI and Momentum) is making higher lows, indicating waning selling pressure and a potential upward reversal.
- Red Line (Negative/Bearish Divergence): This line appears above the price candles. It signals a scenario where the price is making higher highs, but the underlying momentum is making lower highs, indicating fading buying pressure and a potential downward reversal.
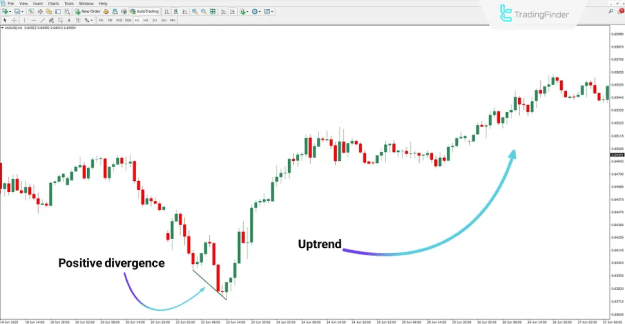
Identifying a Positive Divergence (Buy Signal)
Analyzing a 1-hour AUD/USD chart, the indicator detects a classic positive divergence. While the price chart forms a sequence of lower lows, the indicator plots a green line below this action, signaling that bearish momentum is decelerating. This divergence serves as an early alert for traders to watch for confirming price action to potentially enter buy positions, aligned with their individual strategy parameters.
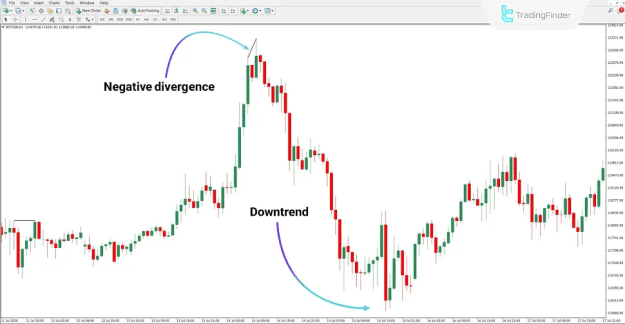
Identifying a Negative Divergence (Sell Signal)
On a Bitcoin (BTC) chart, the Knoxville Divergence Indicator identifies a clear negative divergence. As the price ascends to form a higher high, the indicator plots a distinct red line above the price action, revealing that bullish momentum is failing to keep pace. This warning signal often precedes a price decline, as evidenced on the chart, providing a strategic opportunity to consider sell-side entries.
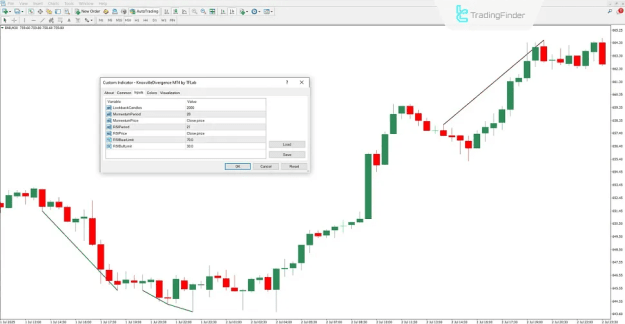
Knoxville Divergence Indicator: Configurable Settings
The indicator's sensitivity and calculation logic can be fine-tuned through several key parameters in its settings panel.
Core Adjustable Parameters Include:
- LookbackCandles: Defines the number of historical candles the indicator analyzes to identify divergence patterns.
- MomentumPeriod: Sets the period used for calculating the Momentum oscillator component.
- MomentumPrice: Determines the price type (e.g., Close, Open) used in the Momentum calculation.
- RSIPeriod: Sets the period used for calculating the Relative Strength Index (RSI) component.
- RSIPrice: Determines the price type used in the RSI calculation.
- RSIBearLimit: Establishes the overbought threshold level for the RSI (e.g., 70). Readings above this level help contextualize bearish divergences.
- RSIBullLimit: Establishes the oversold threshold level for the RSI (e.g., 30). Readings below this level help contextualize bullish divergences.
Conclusion: The Strategic Advantage of Divergence Detection
The Knoxville Divergence Detection Indicator effectively merges the analytical power of RSI and Momentum into a single, visual divergence-spotting tool. By graphically representing divergences as unambiguous green and red lines directly on the price chart, it transforms complex momentum analysis into an accessible and timely alert system. The primary objective of this indicator is to provide early warnings for potential trend reversal zones, enabling traders to anticipate market turns rather than merely react to them. This makes it a valuable asset for intermediate to advanced traders seeking to incorporate momentum-based confirmation into their technical analysis.