https://cdn.tradingfinder.com/file/5...5-by-tflab.zip
https://www.metalsmine.com/thread/13...dicator-on-mt4
https://www.forexfactory.com/thread/...-in-metatrader
Prop Firm DrawDown Protector : Prop Firm Capital Protection Expert MT5 |Forex Money Management: Forex Trade Management Expert MT5 | ICT Concepts Indicator MT5 |Smart Money Concepts Expert MT5 | Smart Money Trap Scanner | Get a free Expert Advisor license via Telegram and WhatsApp
Candle Range in Pips Indicator: Specifications Overview
This indicator is categorized for efficient market analysis on the MetaTrader 5 platform.
Indicator Classification
- Primary Category: Oscillators
- Secondary Categories: Trading Assistant Indicators, Momentum Indicators
- Signal Type: Reversal Indicators
- Timeframe Compatibility: Multi-Timeframe Analysis
- Trading Style Applicability: Intraday Trading
- Market Compatibility: Forex, Cryptocurrency, Stock Markets
- Platform: MetaTrader 5 (MT5)
- Recommended Skill Level: Elementary
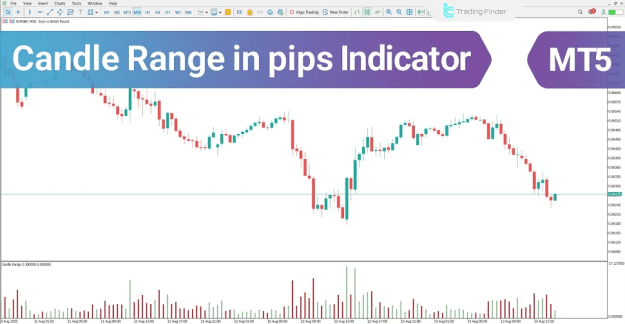
Candle Range in Pips Indicator: Core Functionality and Trading Applications
At its core, the Candle Range in Pips indicator translates candle size into a direct measure of market volatility. Fluctuations in the height of the histogram bars provide critical, real-time insights into market dynamics.
Key Analytical Insights Provided:
- Price Action Strength: Taller bars indicate increased volatility and stronger momentum within that specific period.
- Breakout Probability: Expanding bar sizes, especially near key support or resistance levels, can signal an increased probability of a price breakout.
- Momentum Shifts: Sudden contractions or expansions in range can foreshadow a shift in market momentum.
Strategic Trading Applications:
This tool is integral to multiple trading methodologies. It serves as an effective time filter in Price Action strategies, aids in confirming momentum for Scalping, and helps validate the strength of a Breakout. By quantifying volatility, it plays a crucial role in refining both entry and exit points.
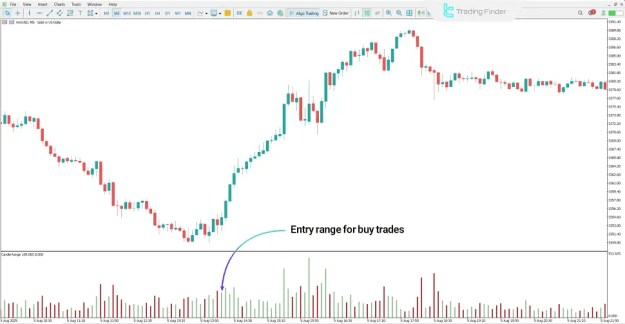
Analyzing the Indicator in an Uptrend
Examining a 5-minute chart for Gold (XAU/USD), a sustained uptrend is often accompanied by a gradual increase in histogram bar height as price advances and breaches previous resistance levels. A bullish breakout that occurs simultaneously with expanding volatility bars signals a strengthening of buyer momentum, potentially confirming a robust entry zone for long positions.
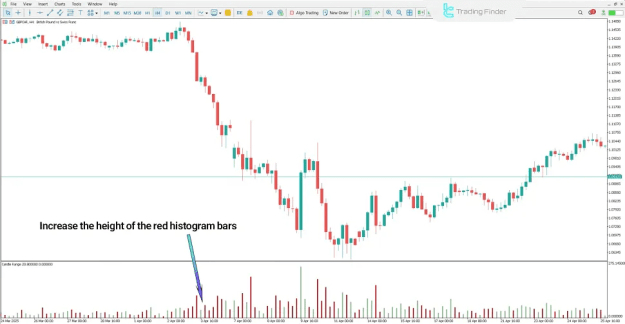
Analyzing the Indicator in a Downtrend
On a 4-hour GBP/CHF chart, the breakdown of a significant support level is frequently validated by widening volatility ranges on the indicator. The formation of long red candles (reflected as tall red histogram bars), often with pronounced upper shadows, can be interpreted as a clear sign of mounting selling pressure. This confluence creates a favorable scenario for considering sell-side entries.
Conclusion
The Candle Range in Pips Oscillator stands out as one of the most direct and effective tools for measuring the actual volatility embodied within individual candlesticks. By providing a clear, quantified perspective on each candle's price movement range, it empowers traders to better assess market momentum strength, anticipate potential breakouts, and identify early signs of trend exhaustion or reversal. This makes it an invaluable component of a technically-focused trader's toolkit for market analysis.