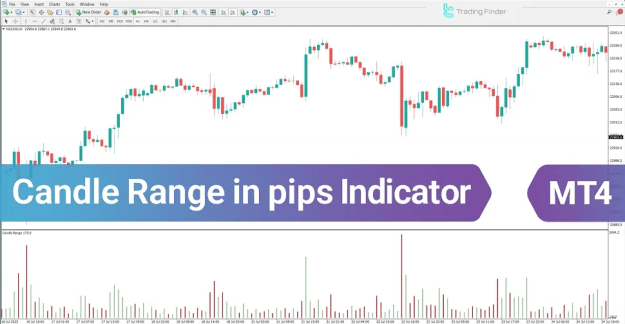
The Candle Range in Pips Indicator MT4 accurately measures the range of each candlestick, defined as the difference between its High and Low. The indicator displays price volatility as a histogram at the bottom of the chart, with each bar representing a single candle’s movement. Green bars indicate bullish candles, while red bars indicate bearish ones, making market trends and momentum visually clear.
 You can download it from this link:
https://cdn.tradingfinder.com/file/5...4-by-tflab.zip
 You can also access the MetaTrader 5 version of this Indicator through this page:
https://www.metalsmine.com/thread/13...r-metatrader-5
 For instructions on how to install:
https://www.forexfactory.com/thread/...-in-metatrader
Prop Firm DrawDown Protector : Prop Firm Capital Protection Expert MT4 | Forex Money Management: Forex Trade Management Expert MT4 |ICT Concepts Indicator MT4 | Smart Money Concepts Expert MT4| Smart Money Trap Scanner | Get a free Expert Advisor license via Telegram and WhatsApp
Key Features
The indicator serves as an oscillator, a trading assist tool, and a momentum indicator for MetaTrader 4. It is suitable for traders of all levels, supports multi-timeframe analysis, and is applicable in intraday trading across Forex, cryptocurrency, and stock markets. The tool is particularly useful for reversal analysis.
Insights from Candle Range
Variations in histogram bar height provide valuable insights into market volatility, the likelihood of key level breakouts, and potential momentum shifts. It is widely used in Price Action, Scalping, and Technical Breakout strategies, acting as a time filter for precise entry and exit points.
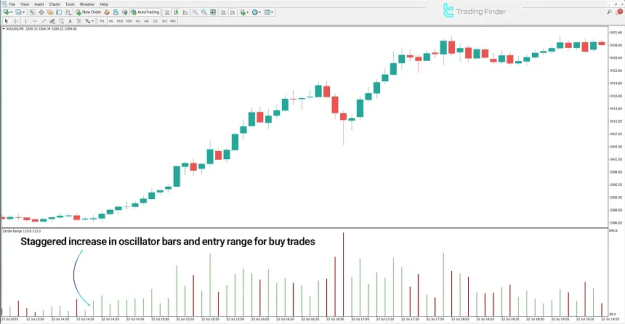
Indicator in an Uptrend
For instance, on the Gold Spot Index (XAU/USD, 5-minute chart), a gradual increase in histogram bar height combined with a bullish breakout above resistance levels indicates strengthening buyers and the potential continuation of the uptrend.
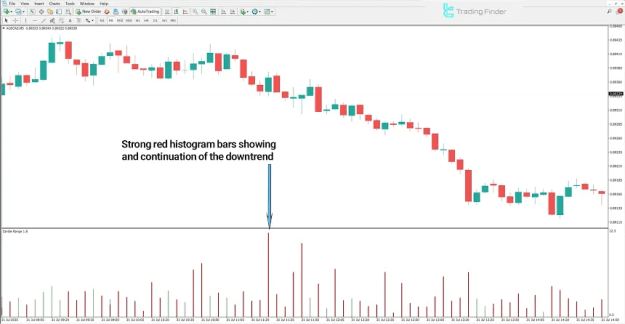
Indicator in a Downtrend
In the AUD/CAD pair (5-minute chart), a breakdown of support levels along with rising volatility and long candles with upper shadows signals increased selling pressure and an intensifying downtrend. When these conditions follow a consolidation period, they indicate a shift from neutral to bearish sentiment.
Conclusion
The Candle Range in Pips Indicator is a specialized tool for assessing candlestick volatility. Analyzing changes in candle ranges provides insight into momentum strength and the potential for trend continuation or reversal. Consistent range expansions or contractions at key price levels reveal market phase transitions and support informed trading decisions.
https://cdn.tradingfinder.com/file/5...4-by-tflab.zip
https://www.metalsmine.com/thread/13...r-metatrader-5
https://www.forexfactory.com/thread/...-in-metatrader
Inserted Video
Prop Firm DrawDown Protector : Prop Firm Capital Protection Expert MT4 | Forex Money Management: Forex Trade Management Expert MT4 |ICT Concepts Indicator MT4 | Smart Money Concepts Expert MT4| Smart Money Trap Scanner | Get a free Expert Advisor license via Telegram and WhatsApp
Key Features
The indicator serves as an oscillator, a trading assist tool, and a momentum indicator for MetaTrader 4. It is suitable for traders of all levels, supports multi-timeframe analysis, and is applicable in intraday trading across Forex, cryptocurrency, and stock markets. The tool is particularly useful for reversal analysis.
Insights from Candle Range
Variations in histogram bar height provide valuable insights into market volatility, the likelihood of key level breakouts, and potential momentum shifts. It is widely used in Price Action, Scalping, and Technical Breakout strategies, acting as a time filter for precise entry and exit points.
Indicator in an Uptrend
For instance, on the Gold Spot Index (XAU/USD, 5-minute chart), a gradual increase in histogram bar height combined with a bullish breakout above resistance levels indicates strengthening buyers and the potential continuation of the uptrend.
Indicator in a Downtrend
In the AUD/CAD pair (5-minute chart), a breakdown of support levels along with rising volatility and long candles with upper shadows signals increased selling pressure and an intensifying downtrend. When these conditions follow a consolidation period, they indicate a shift from neutral to bearish sentiment.
Conclusion
The Candle Range in Pips Indicator is a specialized tool for assessing candlestick volatility. Analyzing changes in candle ranges provides insight into momentum strength and the potential for trend continuation or reversal. Consistent range expansions or contractions at key price levels reveal market phase transitions and support informed trading decisions.
Attached Image(s) (click to enlarge)