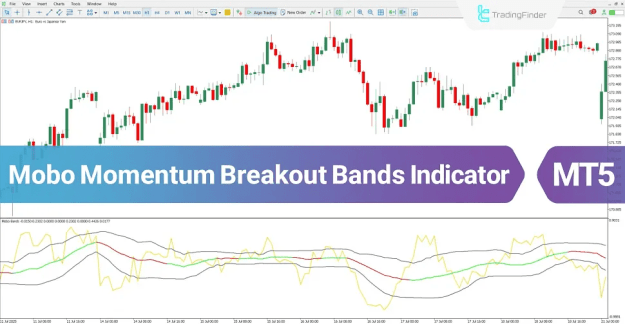
While it shares visual similarities with traditional Bollinger Bands, this indicator utilizes a more responsive algorithm that adjusts intelligently to price volatility. This dynamic adaptation helps traders filter out market noise and capture more reliable entry and exit signals.
https://cdn.tradingfinder.com/file/5...5-by-tflab.zip
https://www.metalsmine.com/thread/13...lator-mt4-free
https://www.forexfactory.com/thread/...-in-metatrader
Key Features and Technical Specifications
The Mobo Momentum Breakout Bands is a versatile tool compatible with the MetaTrader 5 (MT5) platform. It serves multiple analytical purposes and is suitable for various trading environments:
- Indicator Categories: Functions as an Oscillator, a Bands & Channels tool, and a Momentum indicator within MT5.
- Trading Proficiency: Accessible for traders at an Elementary skill level while remaining powerful for professionals.
- Signal Type: Primarily used as a Reversal and Trend-Following indicator.
- Timeframe Versatility: Supports Multi-Timeframe analysis, making it effective for different chart periods.
- Adaptable Trading Styles: Optimized for Swing Trading, Scalping, and Day Trading strategies.
- Asset Compatibility: Applicable across diverse financial markets, including Forex, Cryptocurrencies, and Stocks.
Functional Overview of the Mobo Momentum Breakout Bands
The primary utility of the Mobo Momentum Breakout Bands oscillator is its ability to visualize momentum shifts through color-coded signals. It acts as a comprehensive system for identifying both the strength of a move and specific buy and sell triggers.
The system operates on a crossover logic:
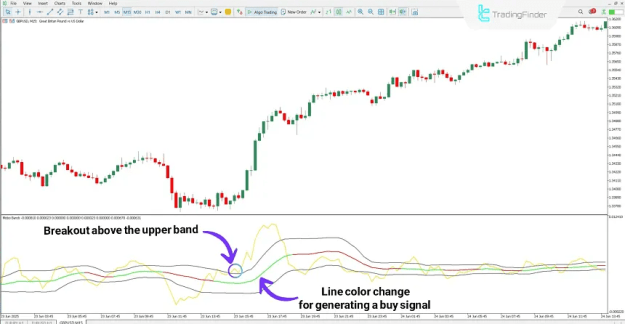
- When the momentum line breaches the upper band, the midline shifts to green, signaling a bullish breakout.
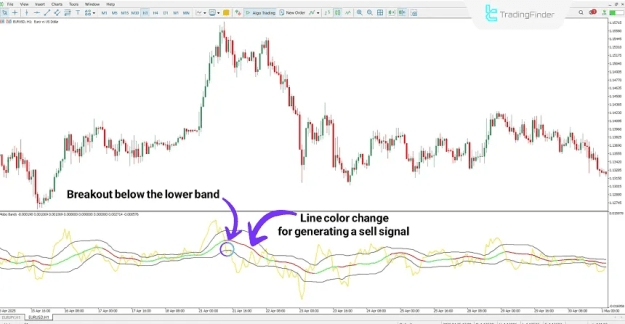
- When the momentum line drops below the lower band, the midline shifts to red, indicating a bearish breakdown.
Identifying Buy Signals
In a typical bullish scenario (such as on a GBP/USD 15-minute chart), a buy signal is generated when the yellow momentum line successfully breaks above the upper band. This technical breakout confirms rising buying pressure, and the subsequent color change of the midline to green serves as the execution trigger for a long position.
Identifying Sell Signals
Conversely, in bearish market conditions (often observed on higher timeframes like the EUR/USD 1-hour chart), a sell signal occurs when the yellow line crosses below the lower band. This movement signifies an increase in selling momentum. The indicator facilitates the trade by turning the midline red, alerting the trader to a potential short-selling opportunity.
Customizable Settings and Parameters
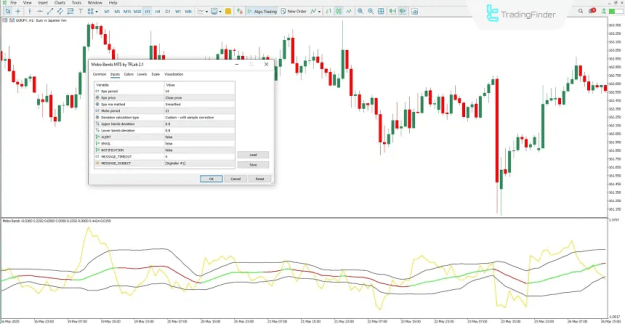
To ensure the indicator aligns with specific trading strategies, the Mobo Momentum Breakout Bands offers several adjustable parameters:
- Dpo Period: Defines the look-back period for the Detrended Price Oscillator calculation.
- Dpo Price: Specifies the price type (Close, Open, High, Low) used for calculations.
- Dpo MA Method: Determines the type of Moving Average applied to the DPO.
- Mobo Period: Sets the time window for the Mobo Bands calculation.
- Deviation Calculation Type: Allows users to select the method for calculating statistical deviation.
- Upper/Lower Bands Deviation: Sets the sensitivity of the bands by adjusting the deviation values.
- Alert & Notification Suite: Includes toggle options for on-screen Alerts, Email notifications, and Push notifications to mobile devices.
- Message Management: Users can define the Message Subject and the Timeout interval between consecutive alerts.
Conclusion
The Mobo Momentum Breakout Bands oscillator stands out as a robust solution for traders seeking to capitalize on market volatility. By integrating deviation-based bands with momentum tracking, it provides a clear visual representation of market shifts. Whether you are identifying a genuine breakout or looking for a reversal zone, this indicator offers the precision required for modern financial markets.