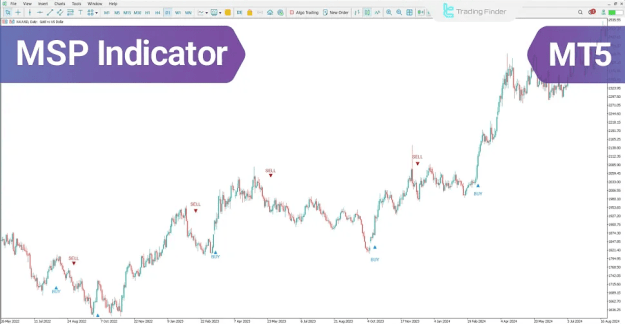
The MSP Indicator MT5 is a technical analysis tool designed to assess market volatility and pinpoint critical trend reversal points by measuring the strength and direction of price movements. In addition to highlighting optimal entry points based on momentum, it can also function as a signal filter, enhancing the reliability of other trading strategies.
 You can download it from this link:
https://cdn.tradingfinder.com/file/5...5-by-tflab.zip
 You can also access the MetaTrader 4 version of this Indicator through this page:
https://www.metalsmine.com/thread/13...er-4-mt4-tflab
 For instructions on how to install:
https://www.forexfactory.com/thread/...-in-metatrader
Prop Firm DrawDown Protector : Prop Firm Capital Protection Expert MT5 |Forex Money Management: Forex Trade Management Expert MT5 | ICT Concepts Indicator MT5 |Smart Money Concepts Expert MT5 | Smart Money Trap Scanner | Get a free Expert Advisor license via Telegram and WhatsApp
Overview of the MSP Indicator
This indicator uses the Average True Range (ATR) with a 14-period setting to determine the average price fluctuation based on the highs and lows of preceding candles.
https://cdn.tradingfinder.com/file/5...5-by-tflab.zip
https://www.metalsmine.com/thread/13...er-4-mt4-tflab
https://www.forexfactory.com/thread/...-in-metatrader
Inserted Video
Prop Firm DrawDown Protector : Prop Firm Capital Protection Expert MT5 |Forex Money Management: Forex Trade Management Expert MT5 | ICT Concepts Indicator MT5 |Smart Money Concepts Expert MT5 | Smart Money Trap Scanner | Get a free Expert Advisor license via Telegram and WhatsApp
Overview of the MSP Indicator
This indicator uses the Average True Range (ATR) with a 14-period setting to determine the average price fluctuation based on the highs and lows of preceding candles.
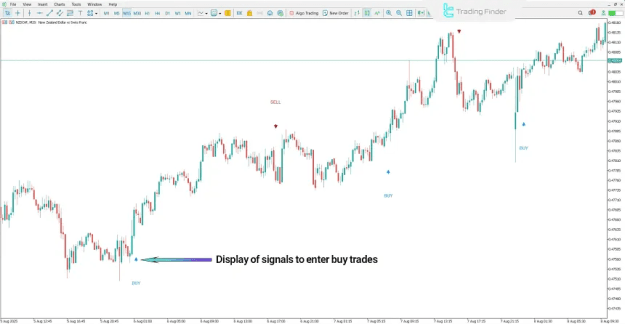
- Buy Signal: When the current price exceeds the ATR average, a blue arrow signals the potential start of a bullish trend.
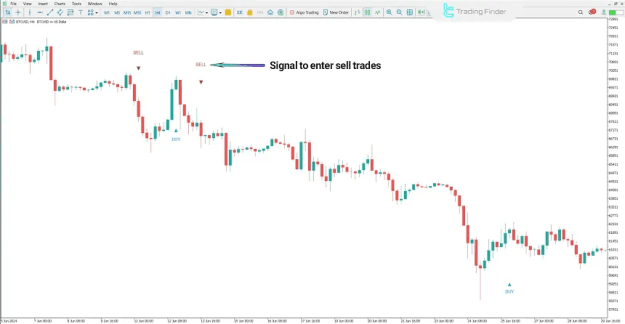
- Sell Signal: When the price falls below the ATR average, a red arrow indicates a potential bearish trend.
Uptrend Signals
- Example: NZD/CHF on a 15-minute chart.
- A blue upward arrow with the text “BUY” reflects growing buyer momentum and the beginning of a bullish trend.
- This establishes a clear buy entry zone for traders.
Downtrend Signals
- Example: Bitcoin (BTC/USD) on a 4-hour chart.
- A red downward arrow labeled “SELL” indicates increasing selling pressure and the potential initiation of a bearish trend.
- This creates a reliable short entry opportunity.
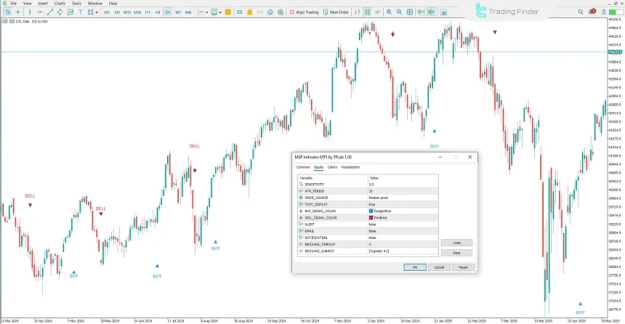
Customizable Settings
The MSP Indicator offers several configurable options on MetaTrader 5 to tailor analysis precisely:
- Sensitivity: Adjusts responsiveness to market fluctuations
- ATR Period: Sets the ATR calculation length
- Price Source: Defines the price data used for calculations
- Text Display: Toggles signal text on charts
- Buy/Sell Signal Colors: Customize signal arrow colors
- Alerts: Popup, email, or push notifications
- Message Timeout & Subject: Customize alert duration and heading
Conclusion
By combining momentum analysis with volatility measurement, the MSP Indicator accurately identifies entry and exit points. Its focus on buyer and seller strength allows traders to detect early bullish and bearish trends using intuitive blue and red arrows, making it ideal for intraday and multi-timeframe trading.
Attached Image(s) (click to enlarge)